Works on: Windows 10 | Windows 8.1 | Windows 8 | Windows 7 | Windows 2012 SHA1 Hash: a7cd0d5c4bad1ea41ed444206c616a49690c50fc Size: 55.53 KB File Format: xlsx
Rating: 2
out of 5
based on 23 user ratings
Downloads: 394 License: Free
Amortization Chart is a free software by ExcelTemplates and works on Windows 10, Windows 8.1, Windows 8, Windows 7, Windows 2012.
You can download Amortization Chart which is 55.53 KB in size and belongs to the software category Other Office Tools. Amortization Chart was released on 2012-03-16 and last updated on our database on 2017-03-04 and is currently at version 1.
Thank you for downloading from SoftPaz! Your download should start any moment now. It would be great if you could rate and share:
Rate this software:
Share in your network:
Amortization Chart Description
Amortization Chart is an Excel template that will allow you to view the amortization graph of your loan.
Loan amortization is a method of debt repayment in equal installments over a specific period of time where the payment amount consists of paying principal and interest with different amount every month.
There are four tabs in this dashboard with description as follow :
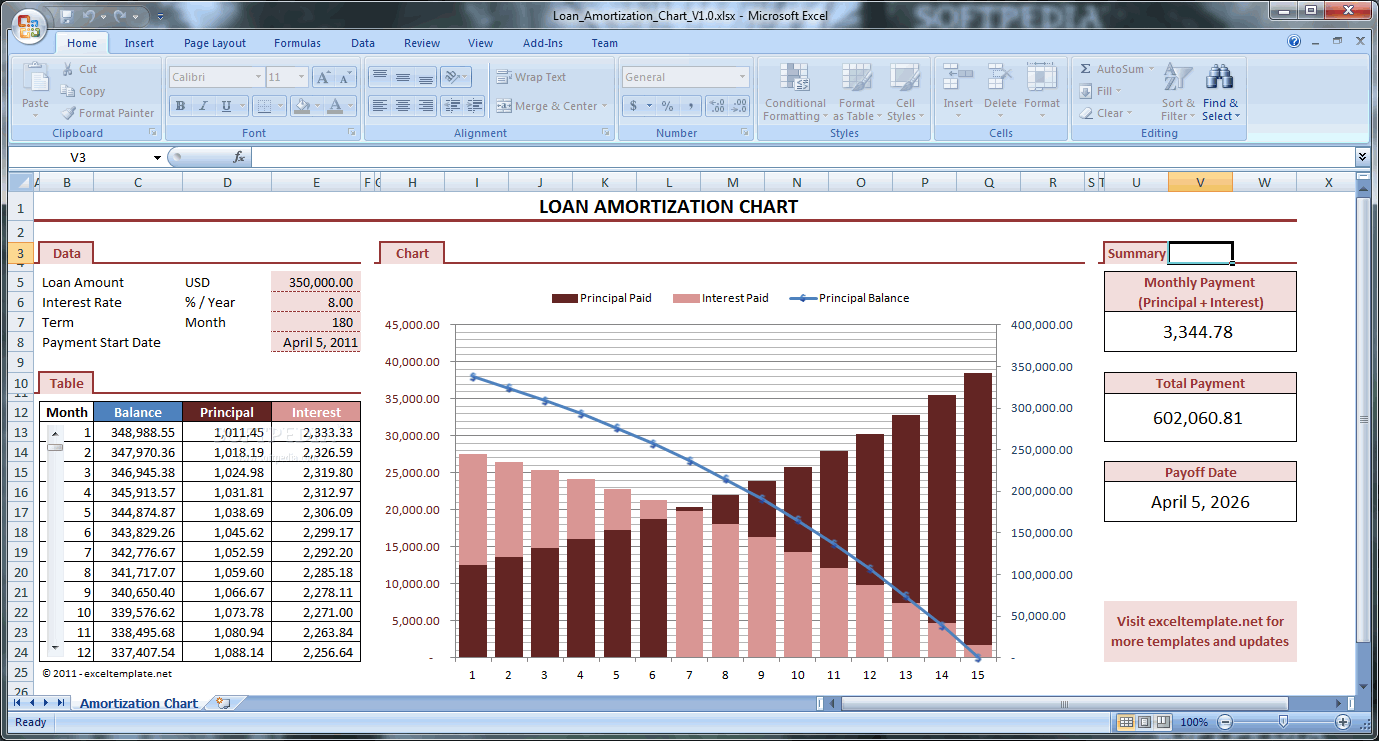
Data Tab:
This is the tab where you have to type your loan amortization parameters. Type your loan amount, bank interest rate (percent/year), payment period (in month) and payment start date in corresponding cells. And the other three tabs will automatically reveal your loan amortization information based on your data.
Table Tab:
This is the area where you can see the break down of your monthly payment. You will see how your principal payment gradually increased and interest payment decreased month by month. And you can see also how your total principal is decreased every month. And there is a scroll bar that you can use to scroll payment information from the first month until the end of payment period.
Chart Tab:
This is a visualization of your payment per year (not per month). You can see that your interest payment (bar with pink color) is higher than principal payment (bar with dark red color) in the first half of your loan period. So, you will see that it is not economically wise to payoff your loan in the first half of your loan period. Those bar values are referred to the left side of the chart. And there is a balance amount that displayed with the blue line where the values referred to the right side of the chart.
Summary Tab:
This is an area where you can see your monthly payment, the total amount of your monthly payment and the payoff date.System requirementsExcel 2007 / 2010


 Windows 7 and above
 View Screenshots(1)
 Comments
 Download


 Similar Software
 Recently Searched
 Software Categories
 Trending Software
 Like Us


