Works on: Windows 10 | Windows 8.1 | Windows 8 | Windows 7 | Windows XP | Windows 2000 | Windows 2003 | Windows 2008 | Windows Vista | Windows 2012 SHA1 Hash: 26a30caa50bd6e965a507233bfb86239c8ae6d54 Size: 1.62 MB File Format: zip
Rating: 1.782608695
out of 5
based on 23 user ratings
Publisher Website: External Link Downloads: 288 License: Demo / Trial Version
Auto Debug System is a demo software by autodebug.com and works on Windows 10, Windows 8.1, Windows 8, Windows 7, Windows XP, Windows 2000, Windows 2003, Windows 2008, Windows Vista, Windows 2012.
You can download Auto Debug System which is 1.62 MB in size and belongs to the software category Debuggers Decompilers Disassemblers. Auto Debug System was released on 2006-08-09 and last updated on our database on 2017-02-18 and is currently at version 4.
Thank you for downloading from SoftPaz! Your download should start any moment now. It would be great if you could rate and share:
Rate this software:
Share in your network:
Auto Debug System Description
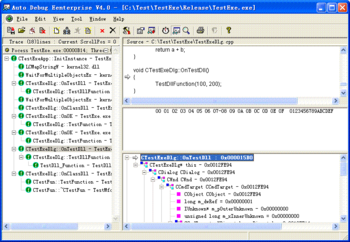
Auto Debug System will trace the target program automatically, record the results of input and output during API call. Support the tracing to COM interface.
Auto analysis the target program, auto display and trace the export functions of DLL. Auto monitor all API and COM Interface.
Auto Debug for Windows is an auto-tracing tool of software. User can set breakpoints, this application will auto trace the target program and record the input and output of function call.
Therefore, the software can help programmer analysis errors, process inside the target program, especially help the programmer analysis the sequences and parameters of the function call.
Features:
ï¿ Recording input parameters and output result of the functions which are set breakpoints in the target program. Therefore, not need to compile the source code, you can monitor the input and output of functions.
ï¿ The best API monitor tool.
ï¿ Tracing Release version with mapfile
ï¿ Debug some Anti-Debug program
ï¿ Supporting debug version and release version, not need source code.
ï¿ Supporting tracing COM Interface.
ï¿ Supporting multithread. Through displaying sequence chart, easy get sequence relationship between all the threads.
ï¿ Supporting spying the parameters of function before and after the function is called.
ï¿ Supporting the function that the target program will dump CallStack when exception occurs.
ï¿ Supporting nested function call. Displaying the tracing result with tree structure, which can get the nested relationship of function call.
ï¿ Supporting Plug-in technology. The user can define input format and output format and the number of parameters of every function. Plug-in technology is used to achieve the function of customizing monitoring result function. Please refer to the Sock_Spy program under the folder of Sample and refer to the sample code for the details.
ï¿ Supporting default monitoring design. The user can set the number of default monitoring parameters, under this condition, all functions have the same number of parameters and all parameters of function entry will be displayed. You can trace and monitor API without programming.
ï¿ Not need to know the prototype of the functions.
ï¿ All the API functions, including the unopened functions that are called inside the DLL, can be monitored in deed.
Where to buy?
Last updated price and discount information 9 years agoupdate now


 Windows XP and above
 View Screenshots(1)
 Comments
 Download


 Similar Software
 Recently Searched
 Software Categories
 Trending Software

 Like Us


