Works on: Windows 10 | Windows 8.1 | Windows 8 | Windows 7 | Windows 2012 SHA1 Hash: ef16cd158b841656c012a95582d24f58b760f2dd Size: 6.75 KB File Format: jnlp
Rating: 1.782608695
out of 5
based on 23 user ratings
Downloads: 1283 License: Free
Data Analysis is a free software by National Council of Teachers of Mathematics and works on Windows 10, Windows 8.1, Windows 8, Windows 7, Windows 2012.
You can download Data Analysis which is 6.75 KB in size and belongs to the software category Science CAD. Data Analysis was released on 2013-08-21 and last updated on our database on 2017-03-29 and is currently at version 1.1.
Thank you for downloading from SoftPaz! Your download should start any moment now. It would be great if you could rate and share:
Rate this software:
Share in your network:
Data Analysis Description
There are many applications and programs on the Internet that you could use in order to manage your files. One of them is Data Analysis.
It's a useful software solution that enables you to calculate multiple indices and generate graphs in order to analyze a set of information, data can be analyzed in an organized in a tabular format.
Sleek and clean user interface
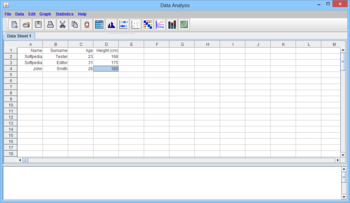
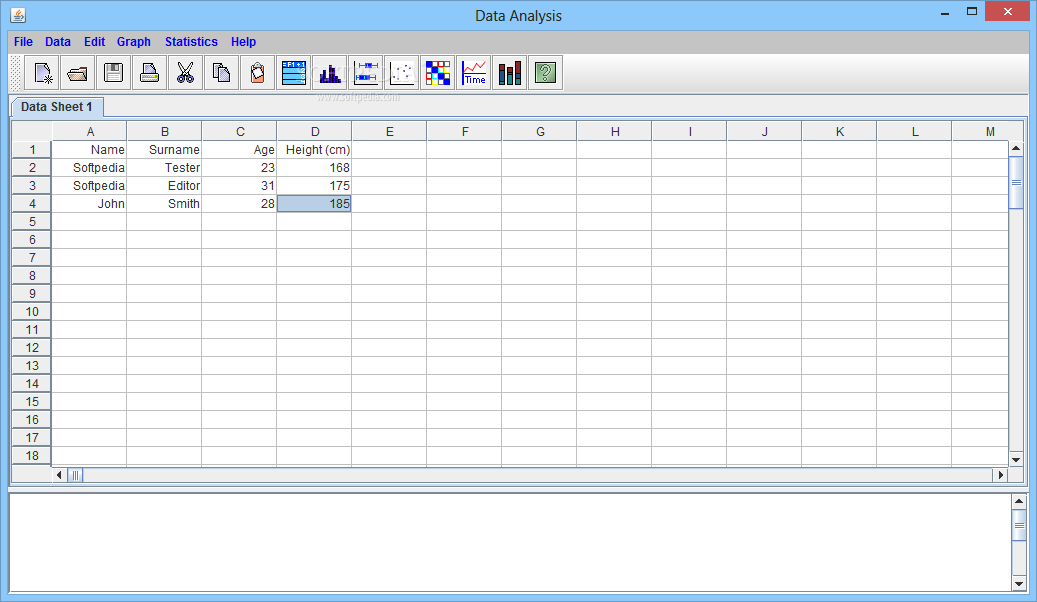
The application takes almost no time to install and it doesn't come with a complicated setup that you would need to complete before you can actually use it. It sports a clean and simple user interface with a neat layout that gives you access to multiple sections.
Data Analysis is a useful software solution that enables you to calculate multiple indices and generate graphs in order to analyze a set of information, data can be analyzed in an organized in a tabular format.
Calculate multiple indices
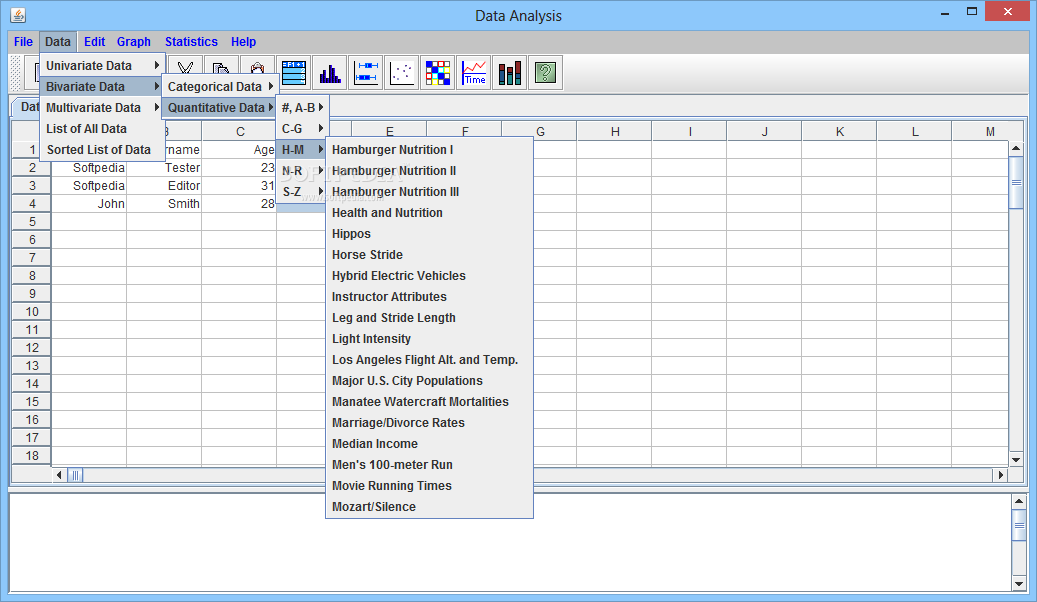
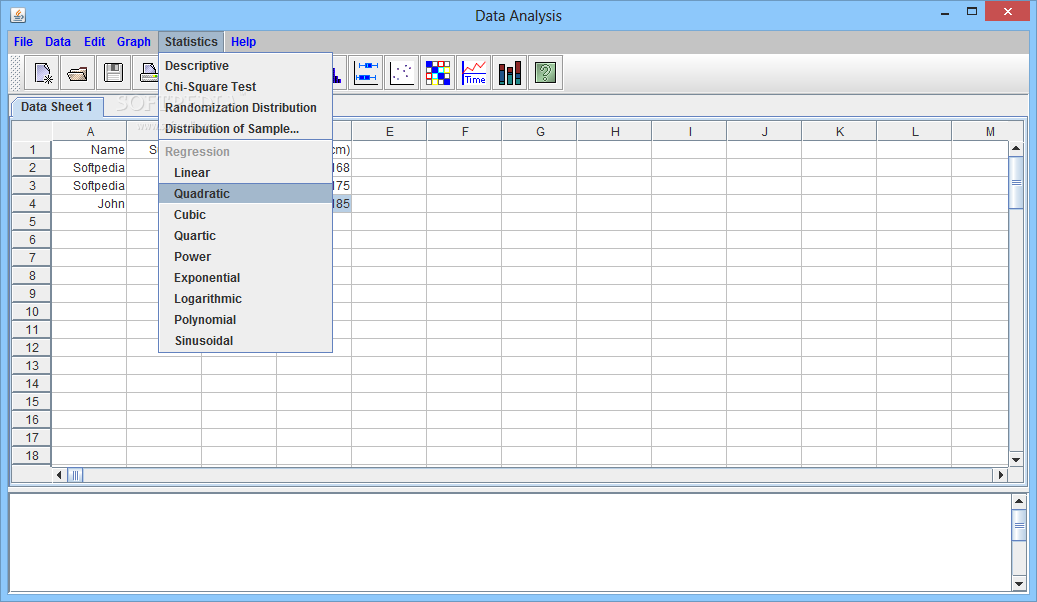
It allows you to analyze univaritate and bivariate data in graphical and numeric displays. A Data Analysis data sheet is like a spreadsheet environment with statistics related functionality. It lets you modify or edit a pre-loaded data sets.
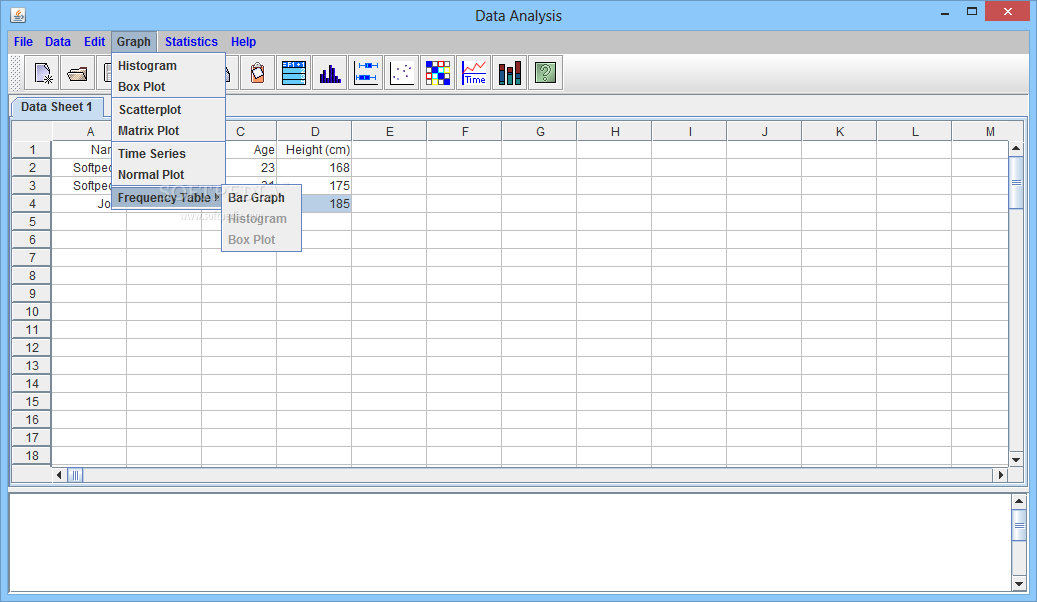
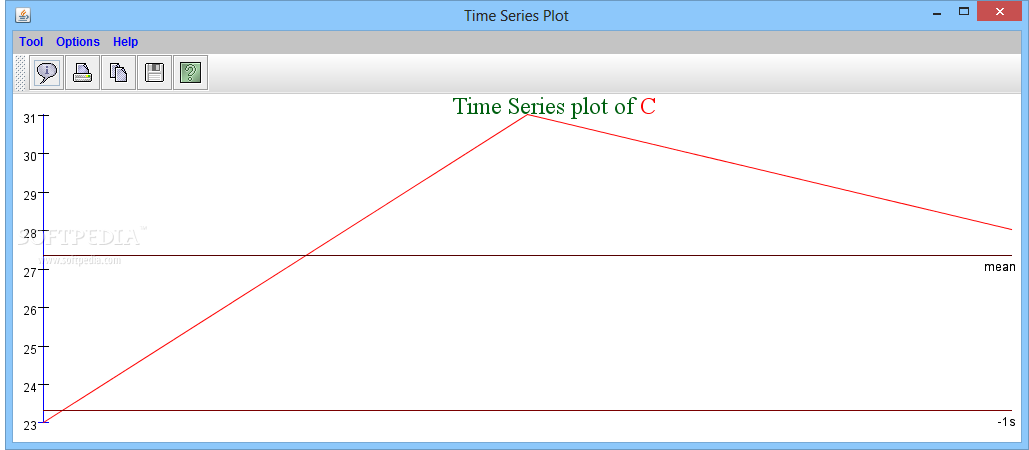
You can use multiple options including cut, copy, paste, fill down, sets of digits, column name, and column formula. Options for graphical display include those for univariate and bivariate data display, statistical plots, and frequency tables.
More features and tools
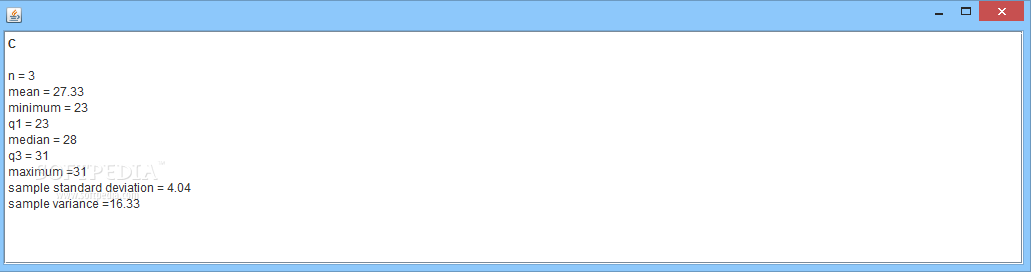
You can view summary statistics for the columns of an active data sheet.
The following calculations are given for each column: n (number of values in the column), Mean (arithmetic average), Minimum (smallest value), Q1 (first quartile), Median (middle value of ordered list), Q3 (third quartile), Maximum (largest value), Sample Standard Deviation (a measure of spread), Sample Variance (the square of the standard deviation).
All in all, Data Analysis is a useful software solution that enables you to calculate multiple indices and generate graphs in order to analyze a set of information, data can be analyzed in an organized in a tabular format.


 Windows 7 and above
 View Screenshots(6)
 Comments
 Download


 Similar Software
 Recently Searched
 Software Categories
 Trending Software

 Like Us


