Works on: Windows 10 | Windows 8.1 | Windows 8 | Windows 7 | Windows XP | Windows 2000 | Windows 2003 | Windows 2008 | Windows Vista | Windows 2012 SHA1 Hash: 9ef86fa59fdda0240285fb3760926b3126aed8b5 Size: 47.38 MB File Format: zip
Rating: 1.913043478
out of 5
based on 23 user ratings
Downloads: 377 License: Free
Data Visualization is a free software by Adam Witkowski and works on Windows 10, Windows 8.1, Windows 8, Windows 7, Windows XP, Windows 2000, Windows 2003, Windows 2008, Windows Vista, Windows 2012.
You can download Data Visualization which is 47.38 MB in size and belongs to the software category Other Office Tools. Data Visualization was released on 2014-06-24 and last updated on our database on 2017-04-01 and is currently at version 7.
Thank you for downloading from SoftPaz! Your download should start any moment now. It would be great if you could rate and share:
Rate this software:
Share in your network:
Data Visualization Description
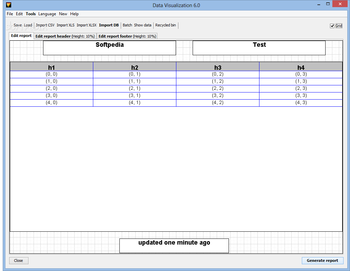
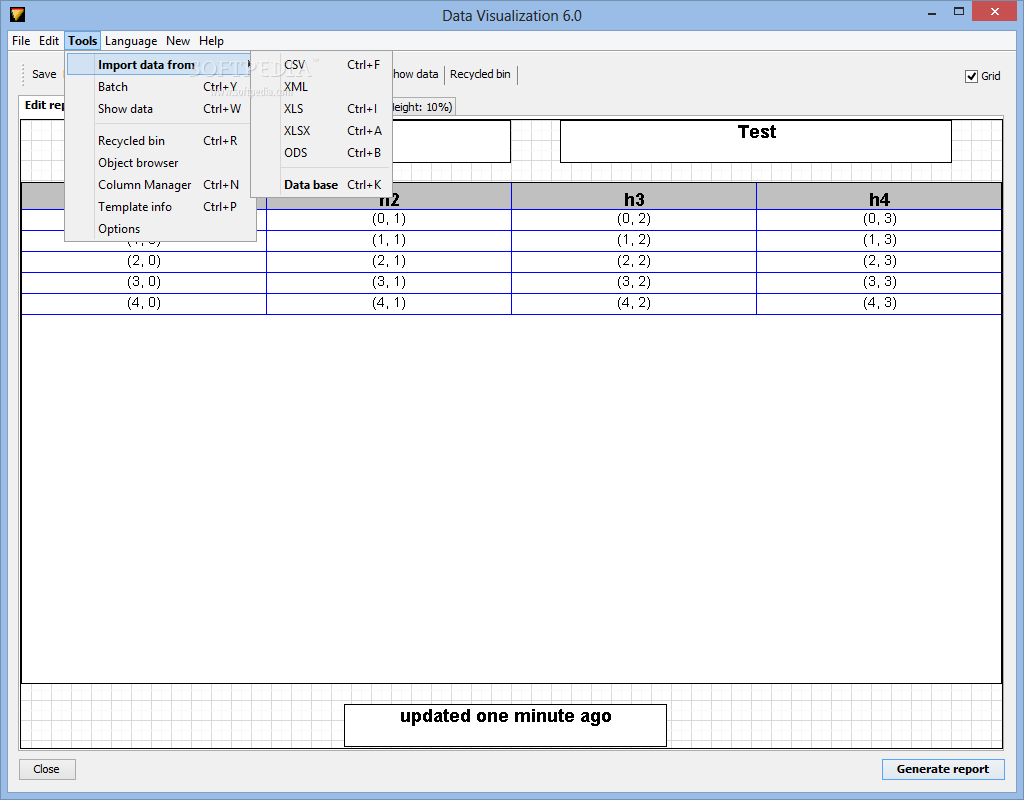
Data Visualization is a reliable and effective piece of software that provides database administrators with a simple means of importing, displaying and exporting data.
Irrespective of the database you choose to export data from, be it Oracle, MySQL, PostgreSQL, Firebird, MS SQL Server, Interbase, SQLite or Apache Derby, to name a few, the program is able to import all the necessary data and export it to whatever format you want such as PDF, HTML, XLS, CSV, RTF or LaTEX. Additionally, you can also import data from CSV, XLS or XLSX files.
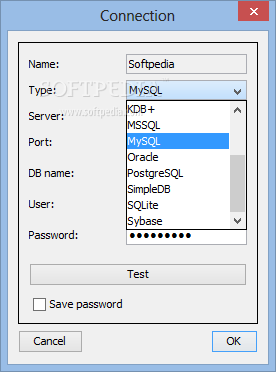
In case you want to import data from a database, you need to press the ‘Import DB’ button and create a new connection by specifying the name, the port number and the login credentials, otherwise you won’t be able to connect to any database.
Once the connection has been made, you can test it (using the Test button), then perform any SELECT query you want.
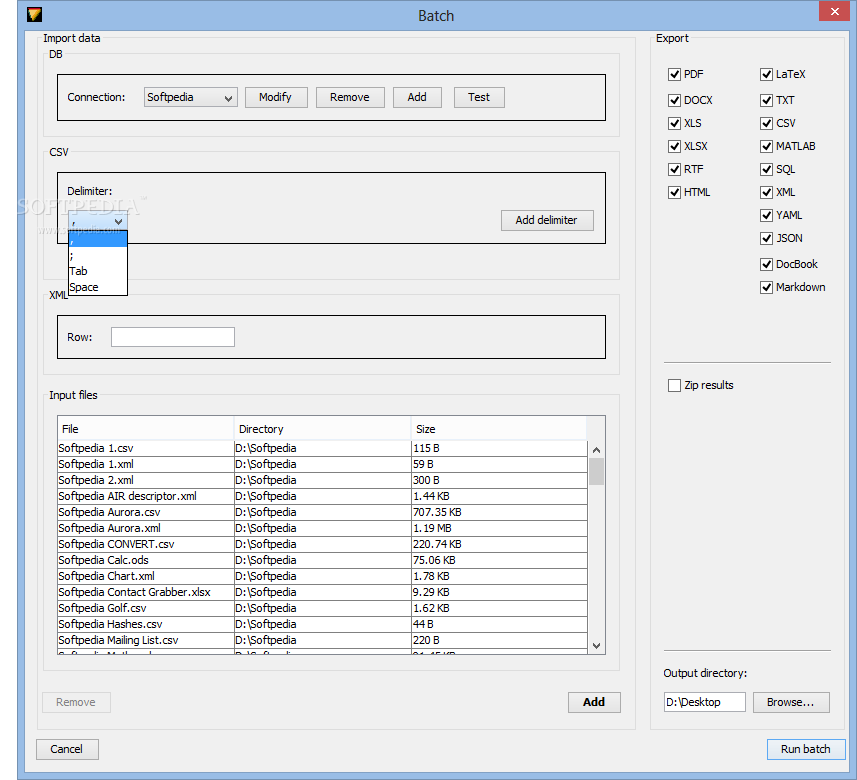
The Batch option, located in the main toolbar, enables you to import data from different sources. For instance, you can set up a new connection to a specific database, choose the CSV and the XML file, then select the export output formats you are interested in.
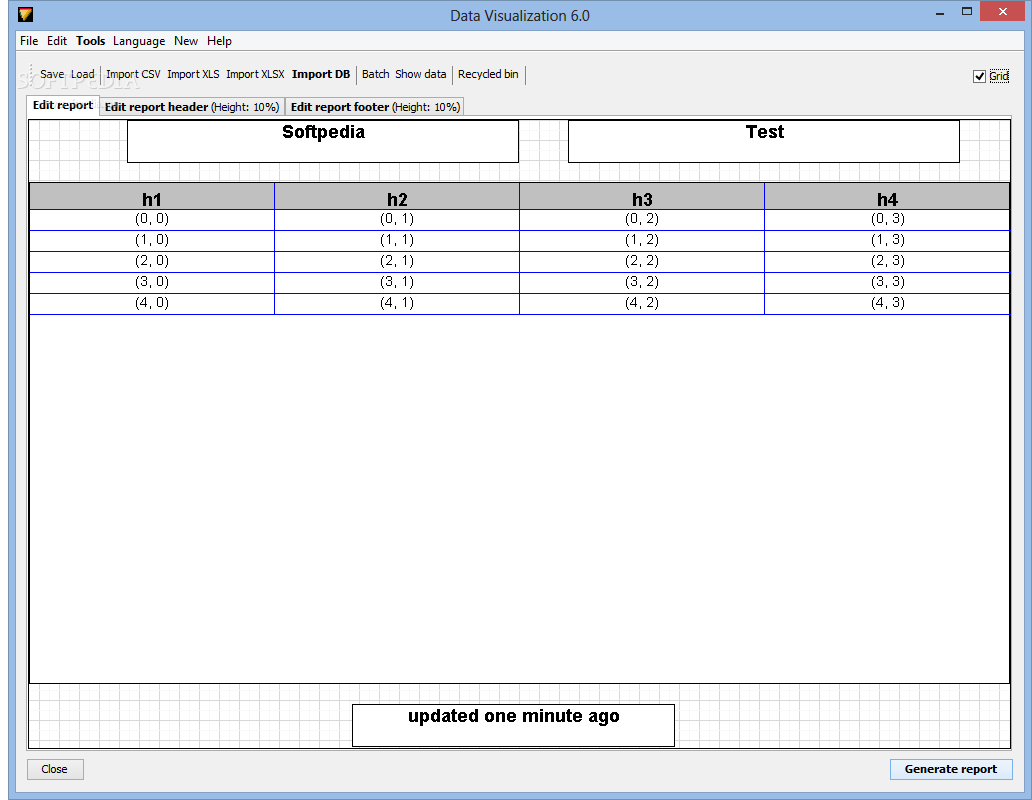
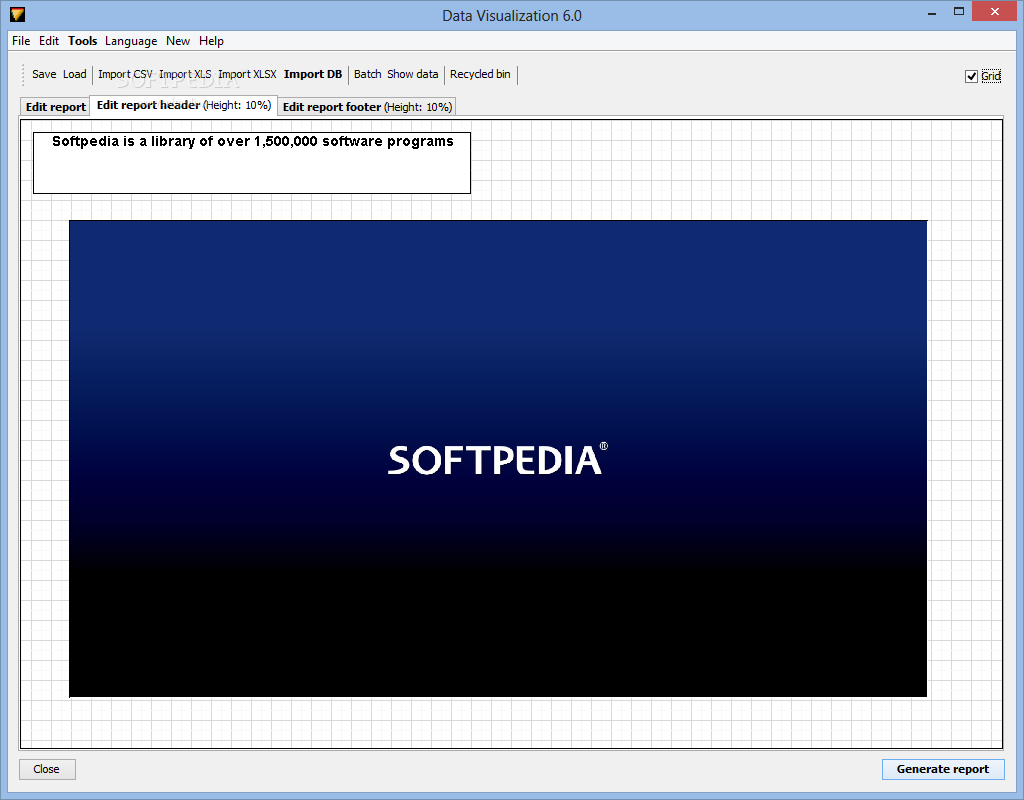
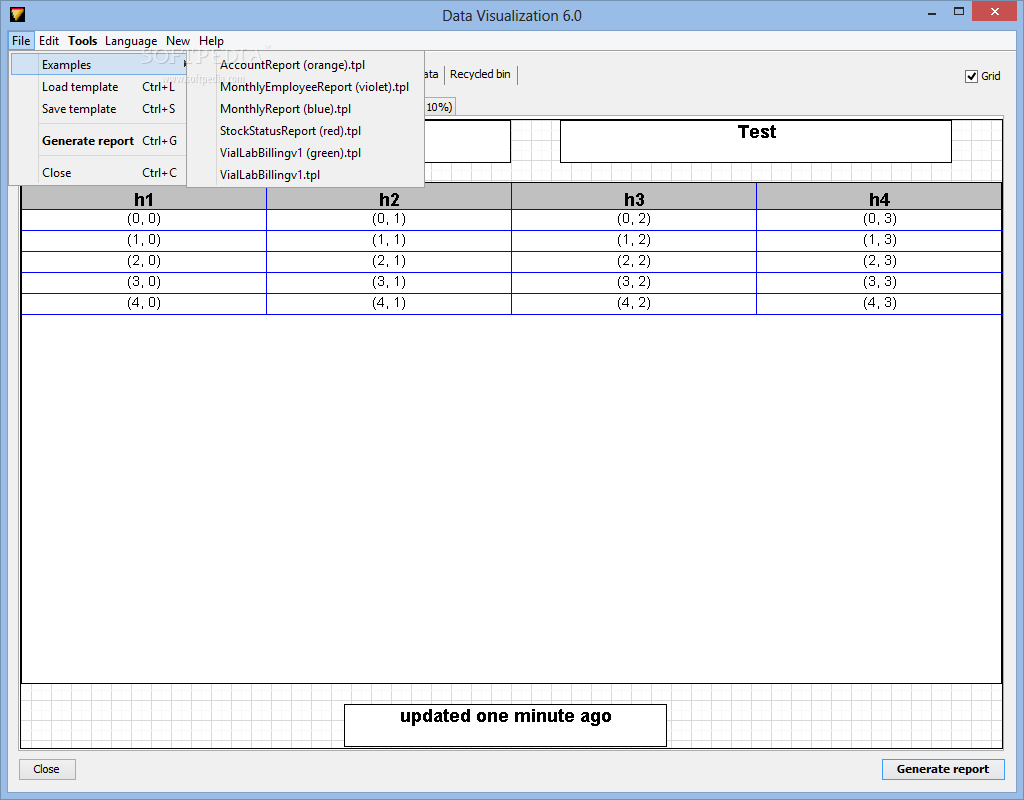
If you want to edit the generated report, you can navigate to the Edit menu from where you can modify the page numbers, change properties such as background color, alignment and font type, or simply reset the current template.
As far as the security is concerned, Data Visualization enables you to perform only SELECT statements, so it does not modify your data. Another important feature is that you can decide whether to store the password or not when connecting to a specific database. This way, you can rest assured that no one will access your data.
To sum things up, Data Visualization comes packed with useful options and intuitive features that help you to create reports from any database or CSV, XLS and XLSX documents.


 Windows XP and above
 View Screenshots(7)
 Comments
 Download


 Similar Software
 Recently Searched
 Software Categories
 Trending Software


 Like Us


