Dataplot icon

Dataplot

1 big stars
Dataplot screenshot
Name: Dataplot
Works on: windowsWindows 7 and above
Developer: NIST
Version: 2010
Last Updated: 02 Mar 2017
Release: 17 Jul 2011
Category: Science CAD
Rate this software:
1365 downloads
screenshotsView Screenshots(1)
commentsComments
downloadDownload
Liked it? Tell others:
details

Dataplot Details

Works on: Windows 10 | Windows 8.1 | Windows 8 | Windows 7 | Windows 2012
SHA1 Hash: a73c9c5625df8a056a167dccfa7d28f72dd9de11
Size: 27.32 MB
File Format: exe
Rating: 1.782608695 out of 5 based on 23 user ratings
Downloads: 1365
License: Free
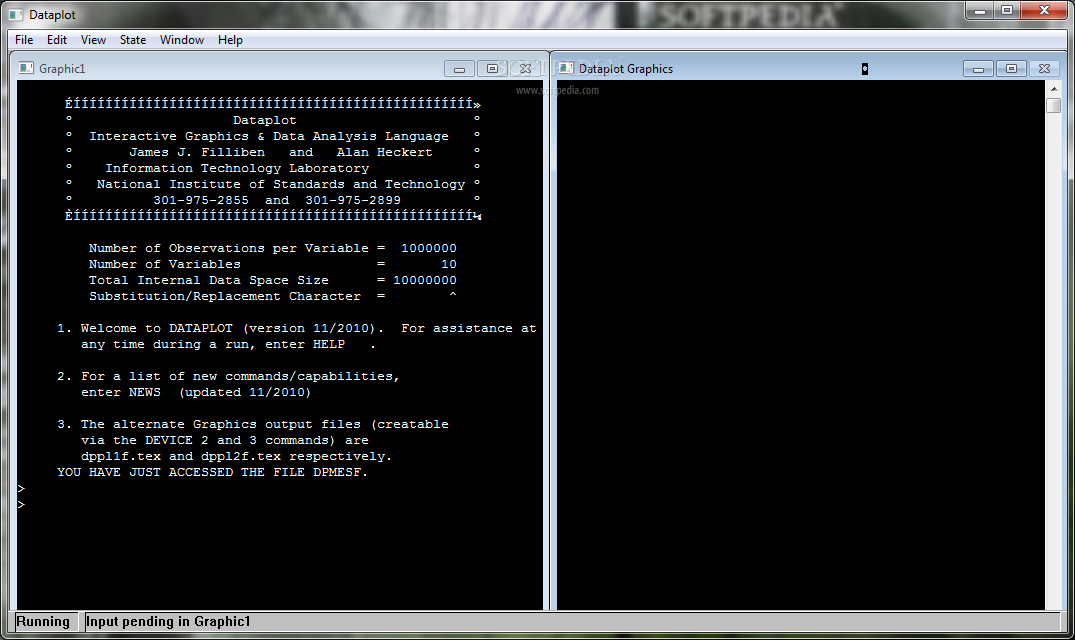
Dataplot is a free software by NIST and works on Windows 10, Windows 8.1, Windows 8, Windows 7, Windows 2012.
You can download Dataplot which is 27.32 MB in size and belongs to the software category Science CAD.
Dataplot was released on 2011-07-17 and last updated on our database on 2017-03-02 and is currently at version 2010.
download button
Thank you for downloading from SoftPaz! Your download should start any moment now. It would be great if you could rate and share:
Rate this software:
Share in your network:
features

Dataplot Description

  • Raw Graphics:
  • 2D, 3D, contour, color, multi-traces, multi-plots/page, character/line/spike/bar plots, auto-labeling, auto-scaling, legends, sizing, etc.
  • Analysis Graphics:
  • Plotting data, plotting functions, mixing data and functions, plotting modeling residuals
  • Presentation Graphics:
  • Hershey fonts, Greek, math, word charts for slides, 3-D bars, Postscript
  • Summary Graphics:
  • Pie charts, histograms, stratified histograms, Pareto charts, error bar plots, X-Y plots, etc.
  • Diagrammatic Graphics:
  • Geometric symbols, electrical symbols, logic diagrams, schematics, etc.
  • Graphical Data Analysis:
  • Histograms, bihistograms, scatter plots, probability plots, PPCC plots, Box-Cox normality plots, Box-Cox linearity plots, symmetry plots, ANOP plots, quantile-quantile plots, multiplotting, statistic subset plots
  • Exploratory Data Analysis:
  • Box plots, stem-and-leaf diagrams, rootograms, median polish, scatter plots, robust smoothing, lowess, biweighting, robust linear/polynomial/non-linear fitting, Box-Cox transformations, general transformations, bootstrap plots, jackknife plots, 4-PLOT assumptions testing, scatter plot matrices, comparative multiplotting
  • Time Series Analysis:
  • Lag plots, autocorrelation plots, periodograms, spectral plots, complex demodulation plots, Allan variance plots, Fourier plots, cross-spectral plots, coherency spectral plots, argand plots, gain plots, runs analysis
  • Smoothing:
  • Moving agerage, moving midmean, triangular, general least squares polynomial smoothing, robust, 3RSR, lowess
  • Fitting:
  • Linear, polynomial, multi-linear, user-definable non-linear, general spline, graphical residual analysis, auto-predicted values and residuals, auto-lack-of-fit F testing, intercept/slop/residual sd/correlation subset plotting, Box-Cox transformational linearity plotting, Tukey biweight/tricube robust fitting, cubic spline interpolation
  • General Data Analysis:
  • Location/variation/randomness/distribution summaries, t-test, Chi-squared tests, F tests, ANOVA, general transformations, subset analyses, Youden interlab plots
  • Statistics/Probability Calculations:
  • Summary tabulation and cross-tab, library of probability functions, cdf's, pdf's, on-line auxiliary file of common probability functions, random number generation, random permutations generation, simulation, moment calculations, stat calculations, stat subset plots
  • Multivariate Analysis:
  • Star plots, profile plots, principal components, Andrews curves, scatter plot matrix, condition plots, multiplotting
  • Experiment Design:
  • On-line design files, (comparative, factorial, Taguchi, response surface designs), random permutations, scatter plots, sign plots, Pareto plots, DEX statistic plots, main effects plots, interaction plots, 2-factor statistic plots, Taguchi signal-to-noise plots, Cpk plots, expected loss plots, etc., predicted value contour plots, Yates 2k analysis, summary square and cube plots, tutorial data files, design simulator, on-line generators and confounding structure file, Ishikawa diagrams
  • Statistical Process Control:
  • Xbar charts, range charts, s control charts, p/Np/C/U control charts
  • Reliability:
  • Weibull plot, Weibull Probability plot, Weibull PPCC plot, survival plots
  • Mathematics:
  • On-line function parsing, plotting functions, roots, analytic differentiation, integration, convolution, extensive library of math functions, complex arithmetic operations, complex roots, FFT, matrix operations (inverse, norm, minor, eigenvalues, eigenvectors, etc.), set operations (union, intersection, Cartesian product, etc.}, polynomial arithmetic operations, logical set operations (and, or, nand, nor), differential equation solver, simplex LP solver, fractal plots
screenshots

Dataplot Screenshots

Dataplot screenshot 1
similarSimilar Software