Works on: Windows 10 | Windows 8.1 | Windows 8 | Windows 7 | Windows XP | Windows 2000 | Windows 2003 | Windows 2008 | Windows ME | Windows Vista | Windows 2012 SHA1 Hash: af5f9342d55d7bf30f96854b444183fdc65db225 Size: 20.79 MB File Format: exe
Rating: 2.347826086
out of 5
based on 23 user ratings
Publisher Website: External Link Downloads: 3358 License: Free
dbForge Monitor is a free software by Devart and works on Windows 10, Windows 8.1, Windows 8, Windows 7, Windows XP, Windows 2000, Windows 2003, Windows 2008, Windows ME, Windows Vista, Windows 2012.
You can download dbForge Monitor which is 20.79 MB in size and belongs to the software category Customer Management. dbForge Monitor was released on 2017-09-07 and last updated on our database on 2017-09-22 and is currently at version 1.
Thank you for downloading from SoftPaz! Your download should start any moment now. It would be great if you could rate and share:
Rate this software:
Share in your network:
dbForge Monitor Description
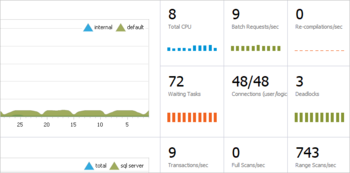
dbForge Monitor is a free add-in for Microsoft SQL Server Management Studio that allows you to track and analyse SQL server performance. The tool includes a variety tools for SQL Server diagnostics, including a bunch of SQL performance metrics allowing to see the comprehensive and clear picture of all processes taking place on the server, detect most expensive queries, waiting tasks, and performance bottlenecks. With dbForge Monitor, you will save hours of time spent on SQL Server performance analysis!
Key Features:* Dashboard:The Overview tab of the tool allows you to see what actually happens at your SQL Server from various angles. A rich collection of metrics for versatile monitoring of SQL Server performance includes:- CPU Utilization- Memory Utlization- Disc Activity- Read and Write Latencies- IO latency.*Data Input/Output:With the IO data tab of the tool, you can easily view statistics of the read and write operations for each database file. In particular, you can track:-Total amount of data reads and writes-Count of input/output operations-Read/write latency.*Wait Statistics:The Wait Stats tab, you can identify the resources that slow down the server. It shows the list of waiting tasks encountered by execution threads because resources required for the request fulfillment were busy or not available.*Top Queries:dbForge Monitor includes an SQL query performance analyzer that allows you to detect and optimize the most expensive queries that overload the system. Apart from the list of the poorly performing queries, the tool shows the query text and query profiling data that can help you to rewrite a query in the most productive way.


 Windows ME and above
 View Screenshots(1)
 Comments
 Download


 Similar Software
 Recently Searched
 Software Categories
 Trending Software


 Like Us


