Rating: 2.173913043
out of 5
based on 23 user ratings
Downloads: 542 License: Free
Debug Diagnostic Tool is a free software by Microsoft and works on Windows 10, Windows 8.1, Windows 8, Windows 7, Windows 2008, Windows Vista, Windows 2012.
You can download Debug Diagnostic Tool which is 0 bytes in size and belongs to the software category Debuggers Decompilers Disassemblers. Debug Diagnostic Tool was released on 2014-05-14 and last updated on our database on 2017-03-31 and is currently at version 2.1.
Thank you for downloading from SoftPaz! Your download should start any moment now. It would be great if you could rate and share:
Rate this software:
Share in your network:
Debug Diagnostic Tool Description
The Debugging Service:
The debugger service (DbgSvc.exe) performs the following tasks:
Attach/Detach the host to processes
Collect performance monitor data
Implement HTTP ping to detect hangs
Inject leak monitor in running processes
Collect debugging session state information
Shows the state of each rule defined
The Debugger Host:
The Debugger Host (DbgHost.exe) hosts the Windows Symbolic Debugger Engine (dbgeng.dll) to attach to processes and generate memory dumps. It also hosts the main analyzer module to analyze memory dumps. Dbghost.exe has no dependency on the service "DbgSvc.exe" and can be used separately.
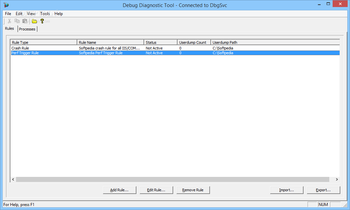
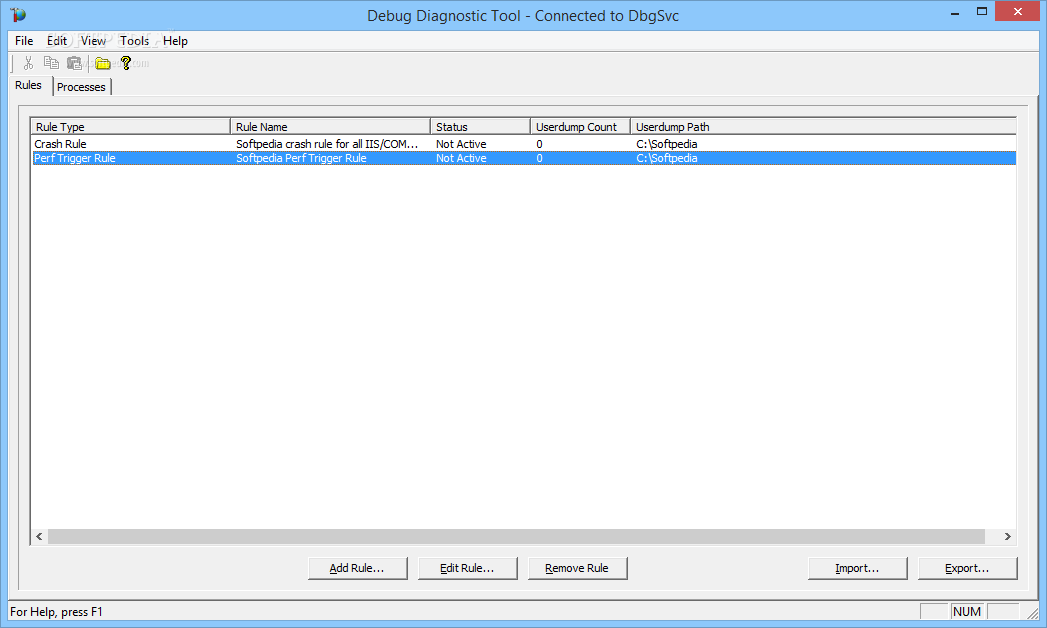
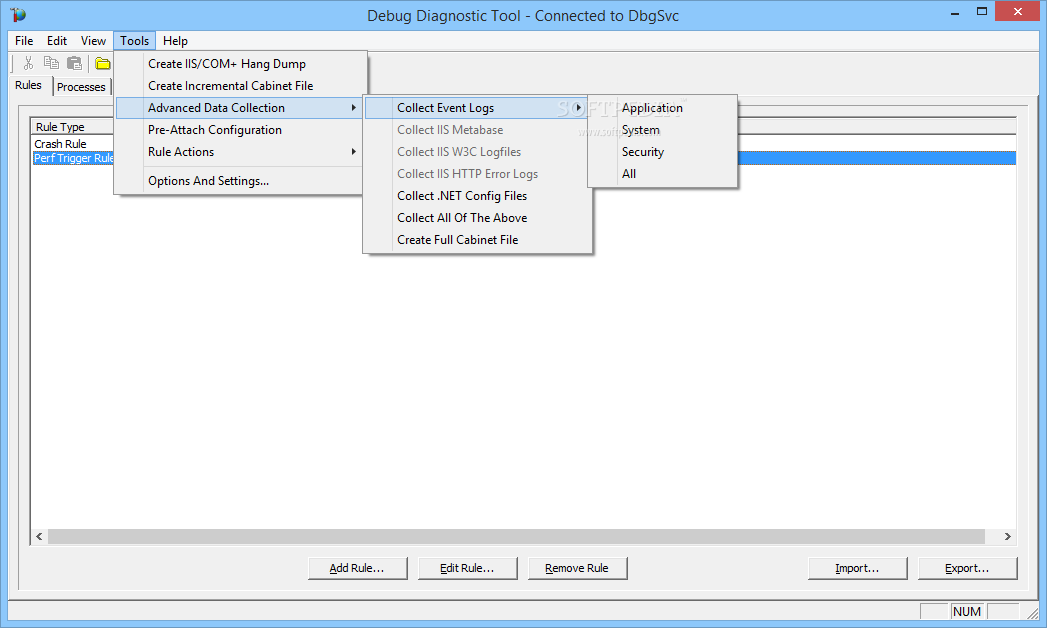
The User Interface:
The user interfaces (DebugDiag.exe and DebugDiagAnalysisOnly.exe) present an interface to analyze memory dumps, automate the creation of control scripts and show the status of running processes, including services.
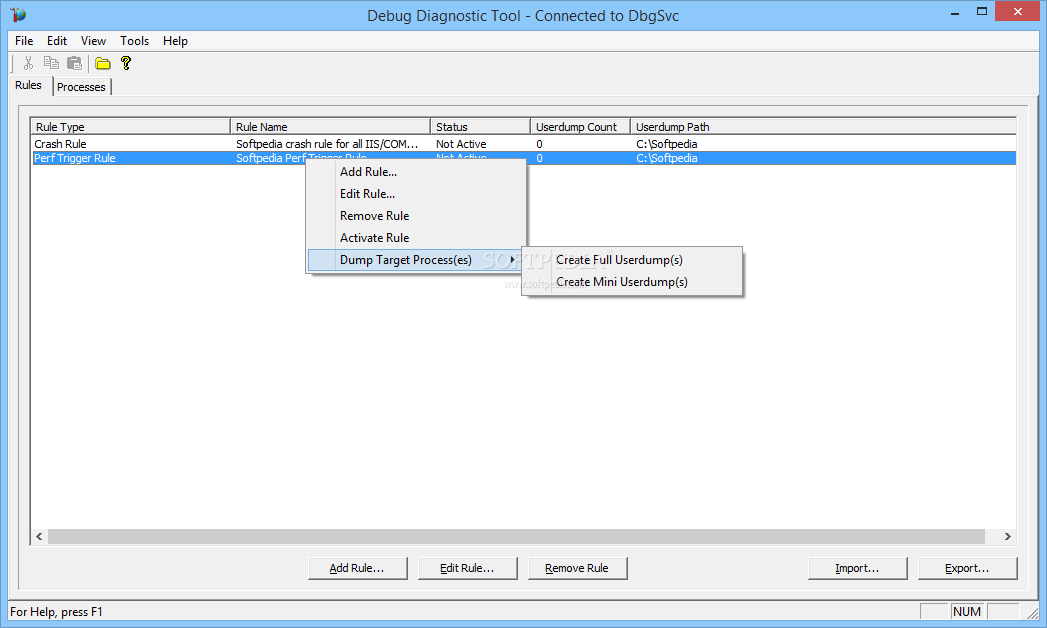
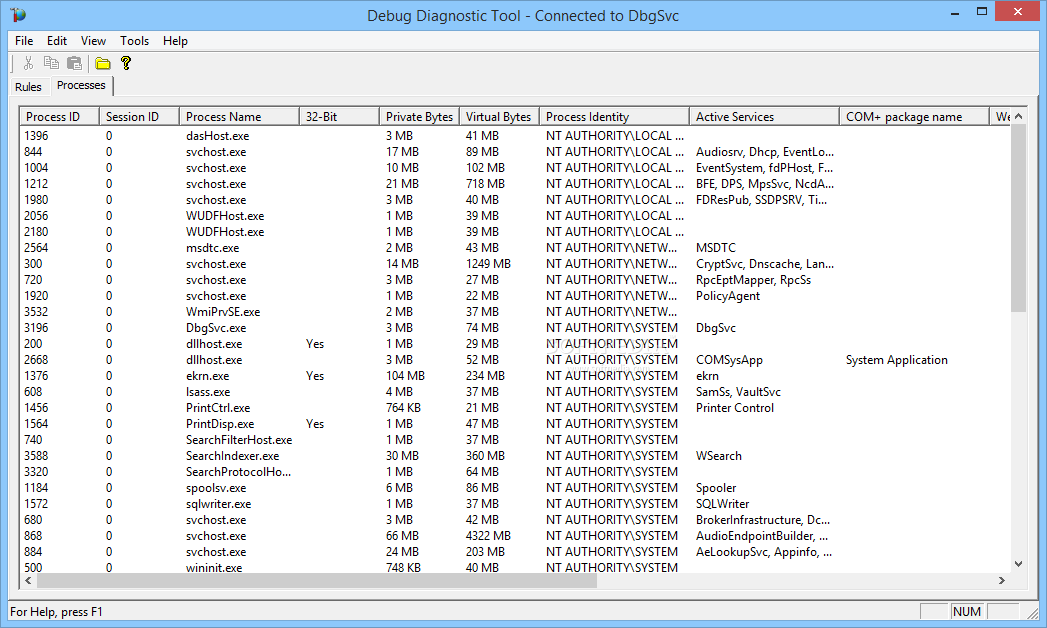
It is composed of 3 views:
Rules: Creates control script for the debugger host through a wizard. The script is located under scripts
Advanced Analysis: Runs a selected "Analysis Script" against one or more memory dumps.
Processes: Shows status of running processes/services


 Windows Vista and above
 View Screenshots(9)
 Comments
 Download


 Similar Software
 Recently Searched
 Software Categories
 Trending Software


 Like Us


