Works on: Windows 10 | Windows 8.1 | Windows 8 | Windows 7 | Windows XP | Windows 2000 | Windows 2003 | Windows 2008 | Windows Vista | Windows 2012 SHA1 Hash: 6446ac3bd1da0a59c56791e9975743719d357d77 Size: 38.2 MB File Format: exe
Rating: 2.52173913
out of 5
based on 23 user ratings
Publisher Website: External Link Downloads: 813 License: Demo / Trial Version
FX Graph Cloud is a demo software by Efofex Software and works on Windows 10, Windows 8.1, Windows 8, Windows 7, Windows XP, Windows 2000, Windows 2003, Windows 2008, Windows Vista, Windows 2012.
You can download FX Graph Cloud which is 38.2 MB in size and belongs to the software category Home and Education. FX Graph Cloud was released on 2017-03-28 and last updated on our database on 2017-04-24 and is currently at version 7.001.
Thank you for downloading from SoftPaz! Your download should start any moment now. It would be great if you could rate and share:
Rate this software:
Share in your network:
FX Graph Cloud Description
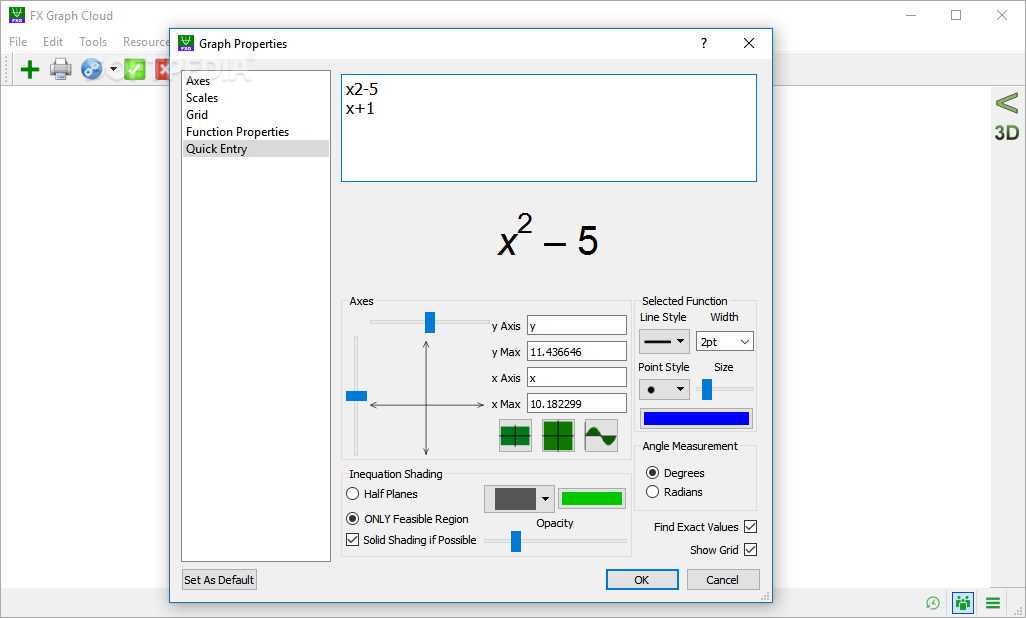
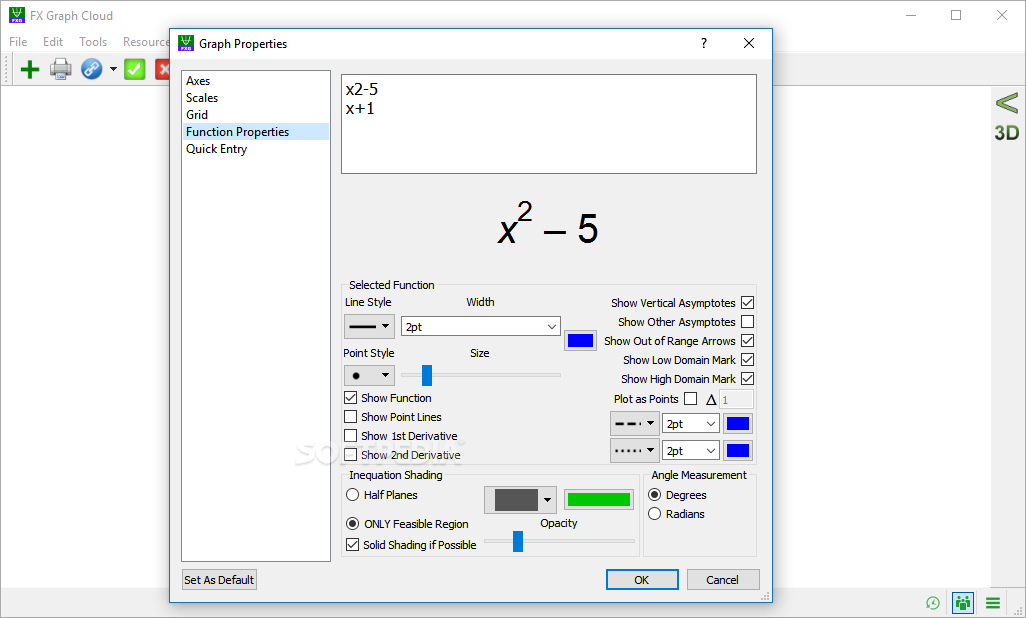
Cartesian Functions:
FX Graph defaults to Cartesian functions. Type any expression involving x (for example 3x3-2x2+2/3) and FX Graph will graph the function.
y = is optional for Cartesian functions.
Functions can be plotted as points.
Function domains can be entered in (-2,4] or -2 < x =, < and = format.
Inequations can be calculated for Cartesian, inverse, implicitly defined and polar functions.
Feasible Regions. FX Graph can calculate and show JUST the feasible region for a system of inequations
Constants and Animations:
a, b, c, d and m are used as constants
Constants can be changed using controllers
Animate graphics using constants
Generate families of curves based on a changing constant
Constants can be used throughout FX Graph. Domains, bounds of integration, tangent points, number of divisions for integral approximations can all be animated using constants
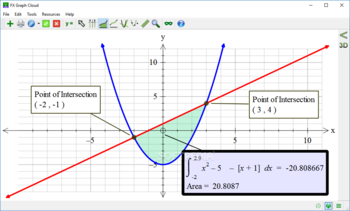
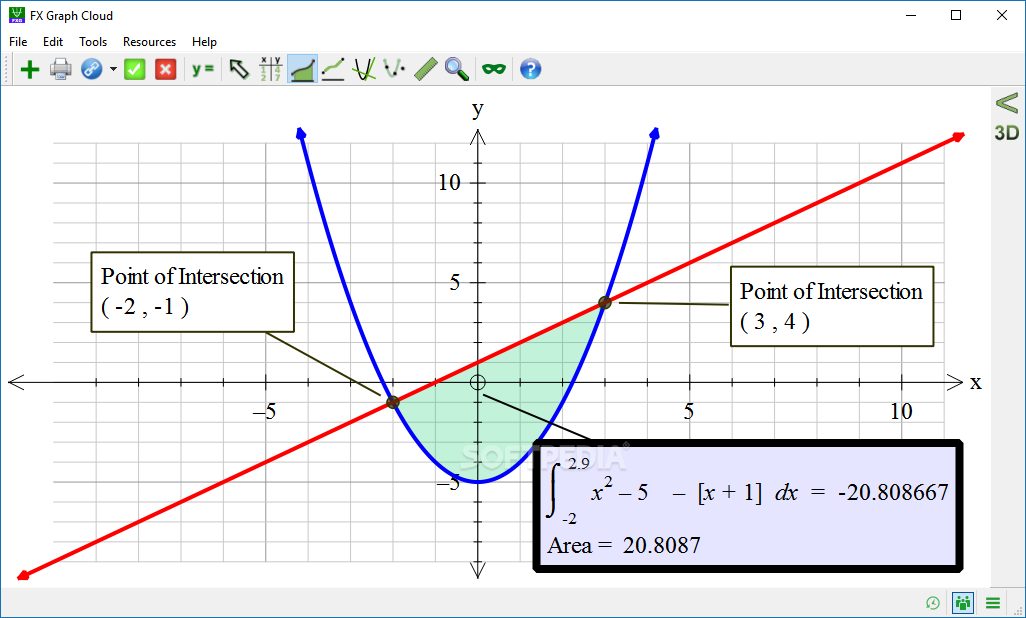
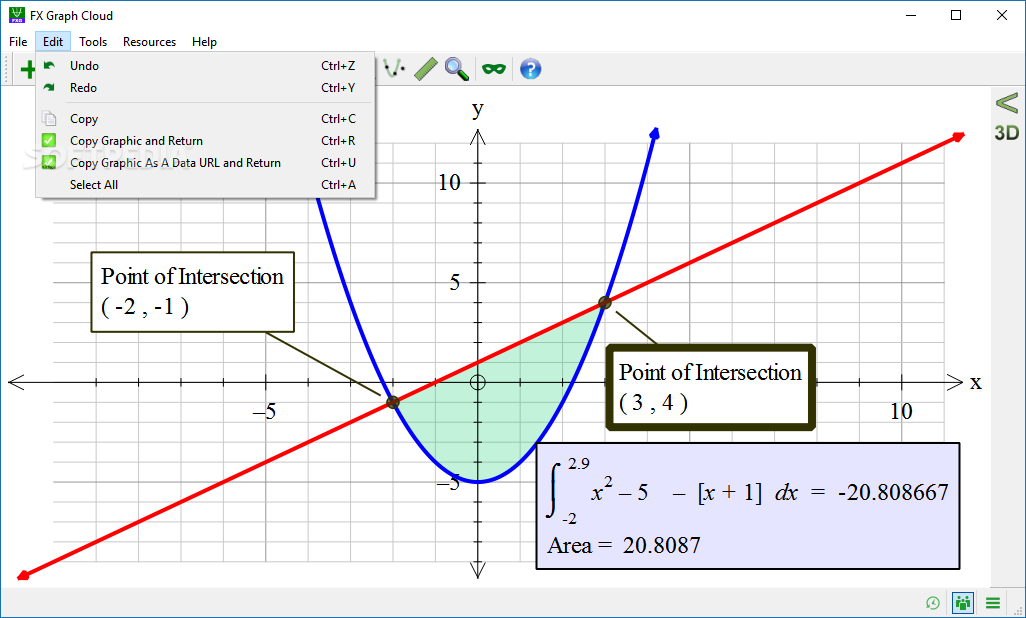
Integrals:
Draw integrals using mouse.
Integrals to x-axis, y-axis and integrals between curves.
Calculate areas and integrals automatically.
Calculate integral approximations using trapeziums, minima, maxima, midpoint, left, right and Simpson's rule.
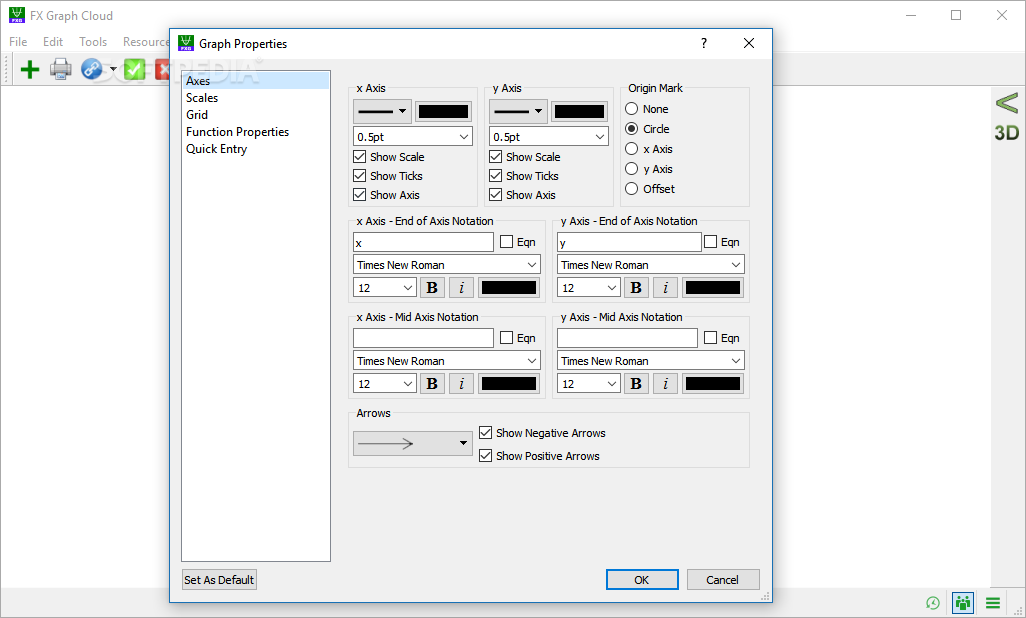
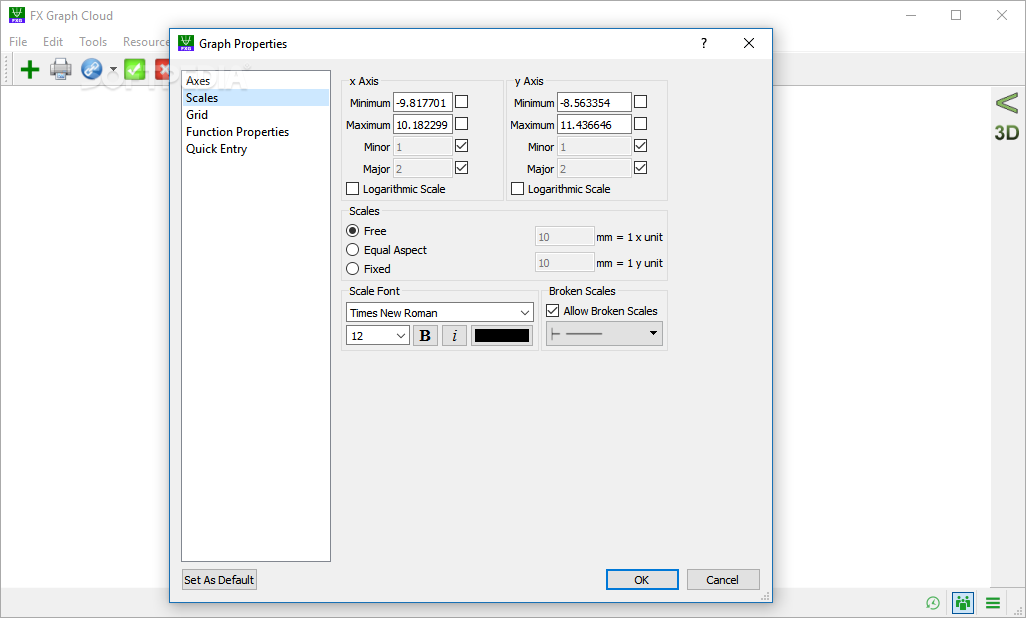
Axes and Grids:
Annotate axes in degrees and fractional multiples of pi.
Quickly set axes and scales using the shape of the axes and maxima. Other settings set automatically.
Full manual control over axes if required.
Ability to show broken axes.
Log and log/log axes.
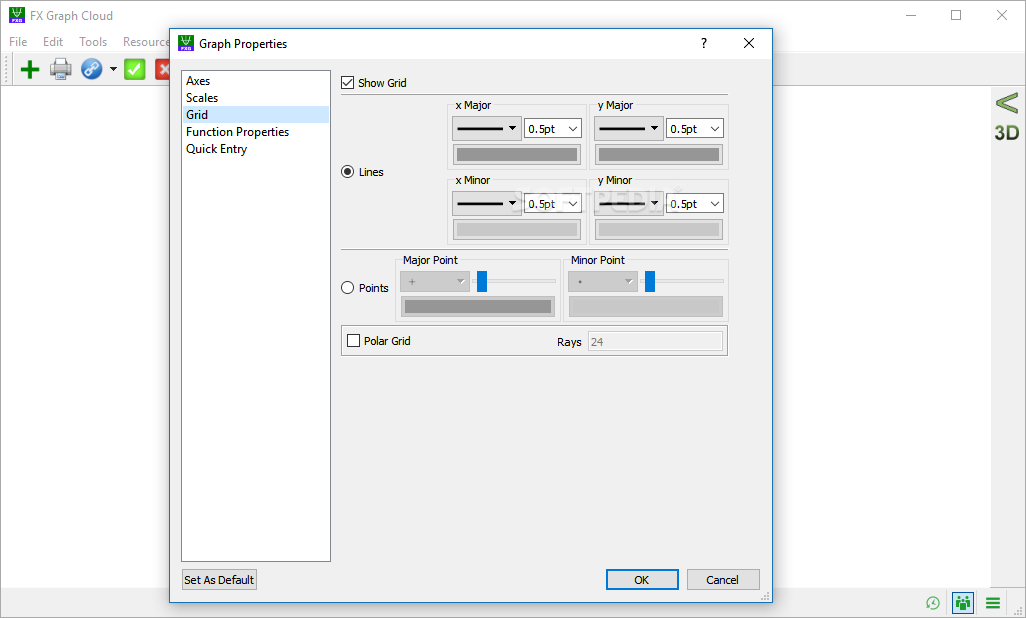
Cartesian grids and dots.
Polar grids and dots.
Points and Vectors:
Plot points eg (1,2).
Join plotted points eg (1,2)+(3,5).
Draw vectors eg .
Add vectors eg +.
Vectors from points eg (1,2)+.
Can use constants in vectors to create vector equation of lines eg (1,2)+a
Complex Numbers:
Plot points on complex plane eg z=2+2i or z = 4cis pi/2
Plot solutions to equations such as z^5=64
Use magnitude of complex numbers eg |z| > 4
Slope Fields:
Use y' to create slope fields.
Plot points on a slope field to solve differential equations.
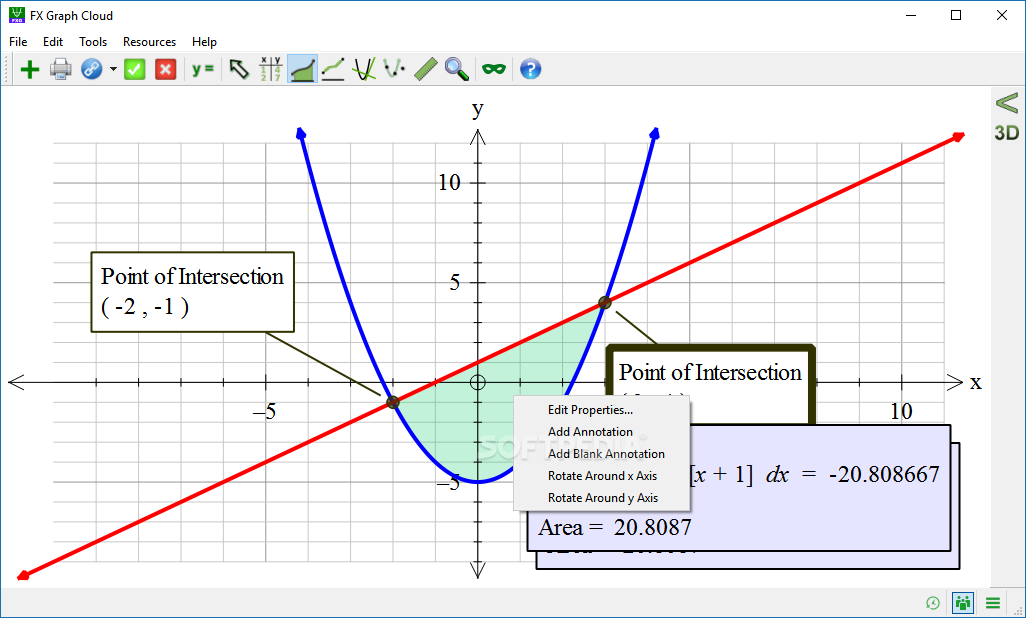
Annotations:
Annotations automatically generated from functions
Annotations can be added to graph using one click
Annotations are automatically updated during animations
Annotations can be fully customised
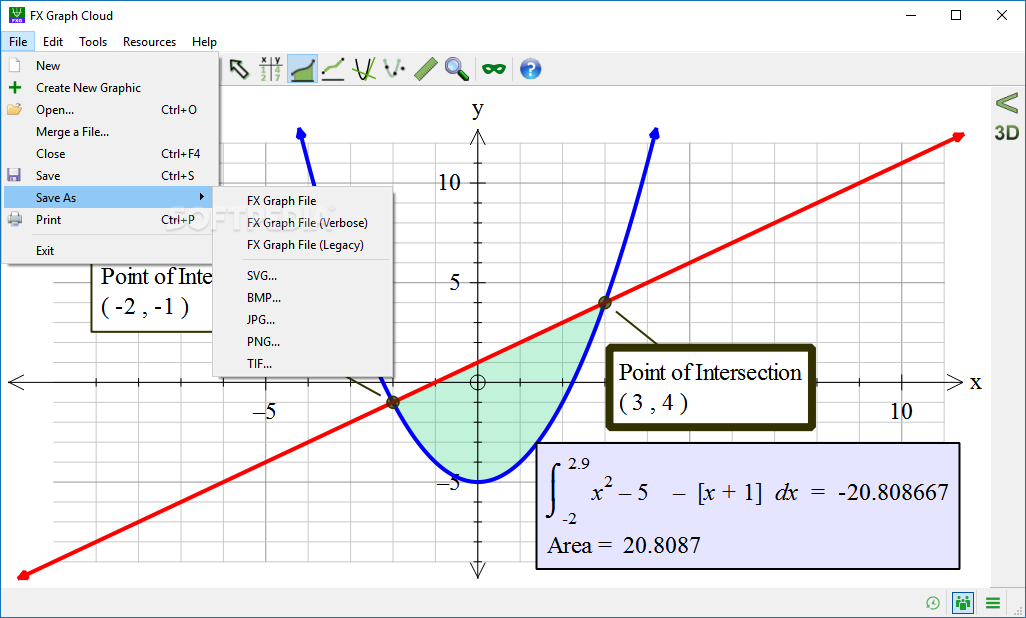
Output Options:
High resolution bitmaps, PNG, TIF and JPG files.
Vector based SVG files.
Insertable OLE object.
Where to buy?
Last updated price and discount information 9 years agoupdate now


 Windows XP and above
 View Screenshots(10)
 Comments
 Download


 Similar Software
 Recently Searched
 Software Categories
 Trending Software


 Like Us


