IBM Thread and Monitor Dump Analyzer for Java Technology Details
Works on: Windows 10 | Windows 8.1 | Windows 8 | Windows 7 | Windows 2012 SHA1 Hash: 31c8a5bbfc8b39b19838b20beb52b89d324fc58d Size: 4.04 MB File Format: jar
Rating: 2.608695652
out of 5
based on 23 user ratings
Downloads: 1993 License: Free
IBM Thread and Monitor Dump Analyzer for Java Technology is a free software by IBM Corporation and works on Windows 10, Windows 8.1, Windows 8, Windows 7, Windows 2012.
You can download IBM Thread and Monitor Dump Analyzer for Java Technology which is 4.04 MB in size and belongs to the software category Other Programming Files. IBM Thread and Monitor Dump Analyzer for Java Technology was released on 2012-12-10 and last updated on our database on 2017-03-21 and is currently at version 4.3.
Thank you for downloading from SoftPaz! Your download should start any moment now. It would be great if you could rate and share:
Rate this software:
Share in your network:
IBM Thread and Monitor Dump Analyzer for Java Technology Description
IBM Thread and Monitor Dump Analyzer for Java Technology is an intuitive and advanced software solution developed to provide Java developers with a reliable means of investigative their thread dumps for a variety of possible problems and generate a diagnosis.
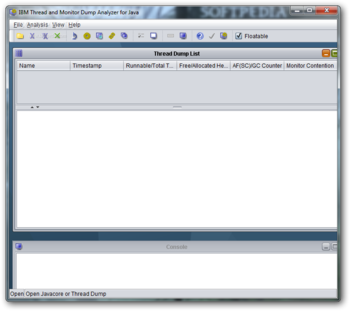
The program is sufficiently easy to work with, which requires a minimal level of effort from you, but an advanced knowledge of the field is more than necessary. After launching the utility, you can simply open one or more thread dumps you wish to work with in IBM Thread and Monitor Dump Analyzer for Java Technology.
The Javacore files will be listed in a side table, along with a wide range of details and information about them, such as 'Name', 'Runnable / Total threads', 'Free / Allocated Heap', 'AF / GC Counter' and 'Monitor' (the number of monitors that are locked).
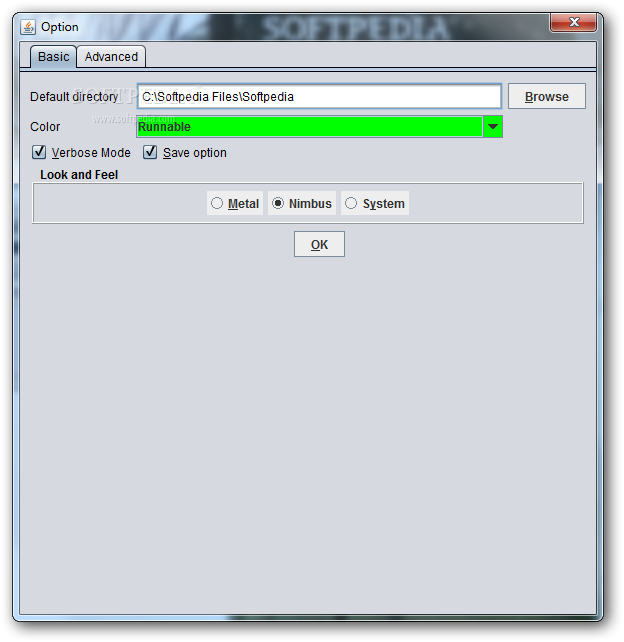
From the context menu, you can choose the 'Basic' or 'Advanced' tab to set up the preferred configuration for the analysis. The information that is subsequently displayed can be viewed with ease, while the relevant details are signaled with different icons for easier identification.
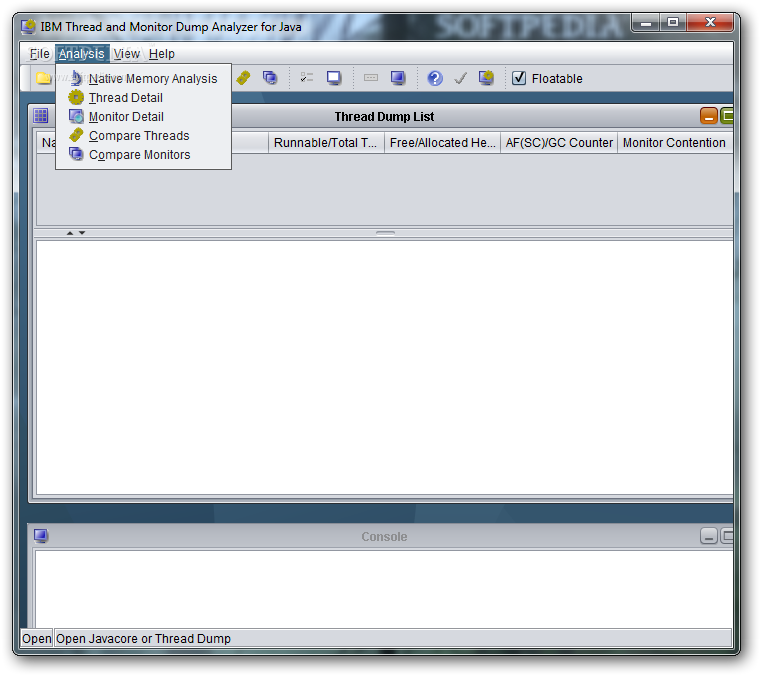
IBM Thread and Monitor Dump Analyzer for Java Technology offers several types of analysis, namely 'Native Memory Analysis', 'Thread Detail', 'Monitor Detail', 'Compare Threads' and 'Compare Monitors', allowing you to select the one you need and run it immediately, under preferred conditions.
To conclude, IBM Thread and Monitor Dump Analyzer for Java Technology is a comprehensive and reliable tool that can help you locate deadlocks, resource contention, potentially hung threads by enabling you to perform Javacore analysis and offering you detailed results on each run, so you can improve your work.
IBM Thread and Monitor Dump Analyzer for Java Technology Screenshots


 Windows 7 and above
 View Screenshots(3)
 Comments
 Download


 Similar Software
 Recently Searched
 Software Categories
 Trending Software


 Like Us


