Works on: Windows 10 | Windows 8.1 | Windows 8 | Windows 7 | Windows 2012 SHA1 Hash: 5d84b74bc2877c8d4f5924e62cf3889b26d9d38f Size: 1.48 MB File Format: exe
Rating: 1.8
out of 5
based on 23 user ratings
Publisher Website: External Link Downloads: 121 License: Demo / Trial Version
LTProf is a demo software by Lightweight Technologies and works on Windows 10, Windows 8.1, Windows 8, Windows 7, Windows 2012.
You can download LTProf which is 1.48 MB in size and belongs to the software category File Editors. LTProf was released on 2009-08-12 and last updated on our database on 2017-03-07 and is currently at version 1.5.
Thank you for downloading from SoftPaz! Your download should start any moment now. It would be great if you could rate and share:
Rate this software:
Share in your network:
LTProf Description
LTProf is a small but powerful code profiler tool for VC++, CBuilder, Delphi and VB applications. Although small, it has a combination of features difficult to find in even the most expensive tools available today:
Line level resolution
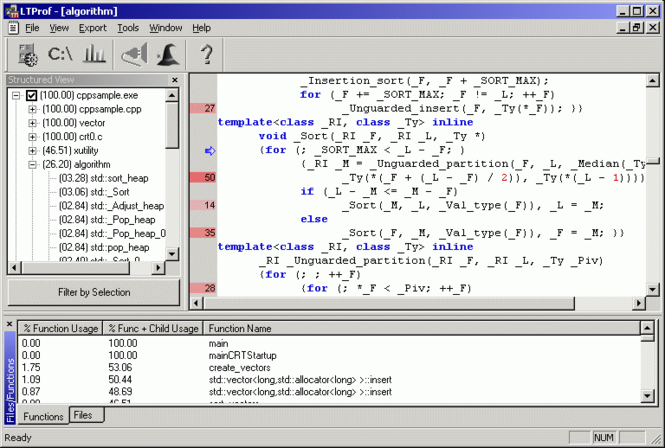
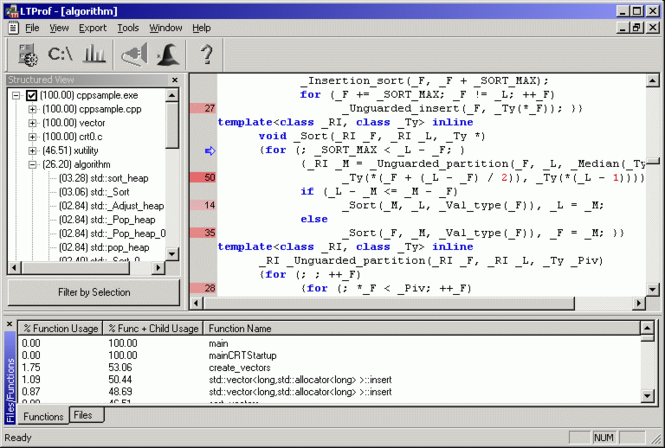
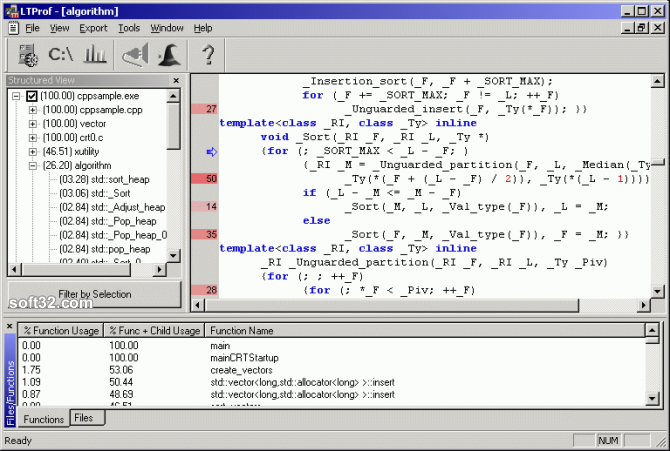
One of the best features of LTProf. Most profilers have a function-level resolution, that is, they can display a list of functions and the time spent in each one. LTProf goes further and displays graphically, on the source file, time spent by each line of code, relative to the function it belongs to. Thus if you have a long algorithm you can see which parts of it are the most time consuming.
No instrumentation, no rebuild, no time wasted
Unlike most profilers on the market LTProf does not require a rebuild or an instrumentation step. The normal build of your application can be profiled at any stage in its development, without any other adjustments.
Profiled program runs at its normal speed
Instrumented programs have additional code inserted in every function to measure the time spent, which greatly reduces the program's speed because some of the instrumented functions are called very often. It is not uncommon that slow programs become completely unusable after instrumentation.
LTProf does not change your application in any way, which means it can run at its normal speed, making your life a lot easier. The amount of processor time consumed by LTProf itself can be adjusted by setting the sampling resolution.
Profile VC++, CBuilder, Delphi and Visual Basic code
as well as any application that stores debug information in PDB/TDS files. LTProf is not language-oriented and it can analyze any program as long as it contains debug information in PDB/TDS files. It can do so even in cross-language applications, for example an EXE written in C++ that uses VB components.
Price
Compare the price of other similar applications with LTProf which retails at only EUR 49.95
Where to buy?
Last updated price and discount information 9 years agoupdate now



 Windows 7 and above
 View Screenshots(3)
 Comments
 Download





 Similar Software


 Recently Searched
 Software Categories
 Trending Software
 Like Us

