Works on: Windows 10 | Windows 8.1 | Windows 8 | Windows 7 | Windows 2012 SHA1 Hash: a330437705db304ae02dadeb4a4cdbf4f17459e5 Size: 386.22 KB File Format: zip
Rating: 2.52173913
out of 5
based on 23 user ratings
Downloads: 1513 License: Free
Mark Jacobs Graph Plotter is a free software by Mark Jacobs and works on Windows 10, Windows 8.1, Windows 8, Windows 7, Windows 2012.
You can download Mark Jacobs Graph Plotter which is 386.22 KB in size and belongs to the software category Science CAD. Mark Jacobs Graph Plotter was released on 2012-01-25 and last updated on our database on 2017-03-03 and is currently at version 1.
Thank you for downloading from SoftPaz! Your download should start any moment now. It would be great if you could rate and share:
Rate this software:
Share in your network:
Mark Jacobs Graph Plotter Description
Research, design and construction nowadays rely on computerization in order to instantly generate accurate results. Everything runs through a series of commands which you input in specialized applications that provide several forms of output, depending on the field of activity. In this regard, Mark Jacobs Graph Plotter does exactly what the name suggests, with the possibility to build more functions simultaneously.
Lightweight with a simple design
A neat advantage is that you don't need to go through a setup process in order for the application to run, which makes it usable on the go if you store it on a Flash drive. This also means that system registries remain intact so your computer won't feel a thing from running it.
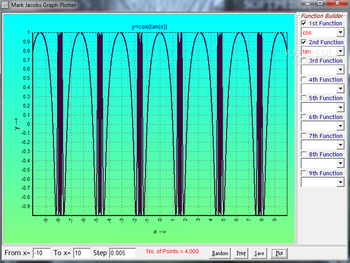
The main window is built so that all functions you get to work with are in plain sight, also providing enough space for the graph itself. It might not be the best looking representation, with the lack of anti-aliasing making drawings seem a little dull.
Combine multiple functions for thorough graphs
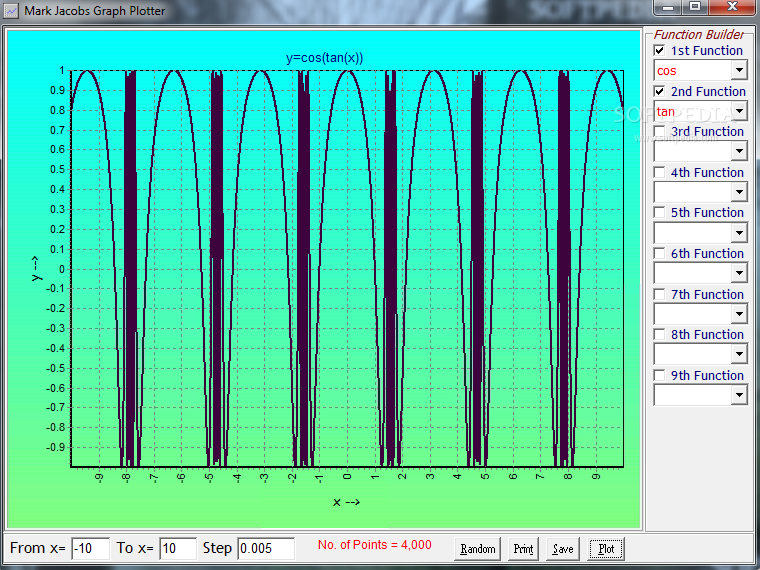
On the other hand, the core function is accuracy and this point is achieved. With up to nine configurable functions, you'll be able to get just about any representation. Each comes as a set of predefined functions which you pick from a drop-down menu and range from sin, cos to log and exp.
Needless to say that the range of your function needs to be specified and this is simply done by filling in corresponding fields for minimum and maximum. You don't need to use all functions, with the possibility to enable all or none. Sadly, all functions are piled up in a single expression you can view as the math equivalent, with no options to plot more functions and differentiate them through colors.
Random representations and export options
You can zoom in and out in any region for careful analysis and there are even a few export options. There's an option to save a graph but only under the BMP format, or you can print it out on a sheet of paper. Moreover, to test out the application, you can have a little fun and abuse the “Random†button for various representations.
To end with
All in all, Mark Jacobs Graph Plotter is a small and practical application on which you can rely for such tasks. Although it feels a little rough around the edges, the overall process is done in the blink of an eye, with editing fields and implemented functions allowing you to combine various possibilities to meet any demand or specification.


 Windows 7 and above
 View Screenshots(1)
 Comments
 Download


 Similar Software
 Recently Searched
 Software Categories
 Trending Software


 Like Us


