Works on: Windows 10 | Windows 8.1 | Windows 8 | Windows 7 | Windows XP | Windows 2000 | Windows 2003 | Windows 2008 | Windows Vista | Windows 2012 File Format: exe
Rating: 2.347826086
out of 5
based on 23 user ratings
Downloads: 421 License: Free
NVPerfKit is a free software by Nvidia and works on Windows 10, Windows 8.1, Windows 8, Windows 7, Windows XP, Windows 2000, Windows 2003, Windows 2008, Windows Vista, Windows 2012.
You can download NVPerfKit which is 36.15 MB in size and belongs to the software category Debuggers Decompilers Disassemblers. NVPerfKit was released on 2008-10-15 and last updated on our database on 2017-02-22 and is currently at version 6.1.
We also have NVPerfKit 64bit version which is 49.55 MB in size and will work on x64 computers.
Thank you for downloading from SoftPaz! Your download should start any moment now. It would be great if you could rate and share:
Rate this software:
Share in your network:
NVPerfKit Description
NVPerfKit is a comprehensive suite of performance tools to help debug and profile OpenGL and Direct3D applications. NVPerfKit will give you access to low-level performance counters inside the driver and hardware counters inside the GPU itself. The counters can be used to determine exactly how your application is using the GPU, identify performance issues, and confirm that performance problems have been resolved.
The performance counters are available directly in your OpenGL and DirectX applications and in tools such as Intel VTune and Graphic Remedys gDEBugger via the Windows Management Instrumentation (WMI) Performance Data Helper (PDH) interface. A plug-in supporting Microsoft PIX for Windows is also provided, giving you low-latency access to NVPerfKit performance counters directly from the driver.
Here are some key features of "NVPerfKit":
· Supports GeForce 8 and 9 series GPUs, as well as earlier models.
· Supports DirectX10 on Windows Vista
· Supports DirectX 9 on Windows XP and Windows Vista
· Supports Managed and XNA applications
· No special driver needed on Windows Vista
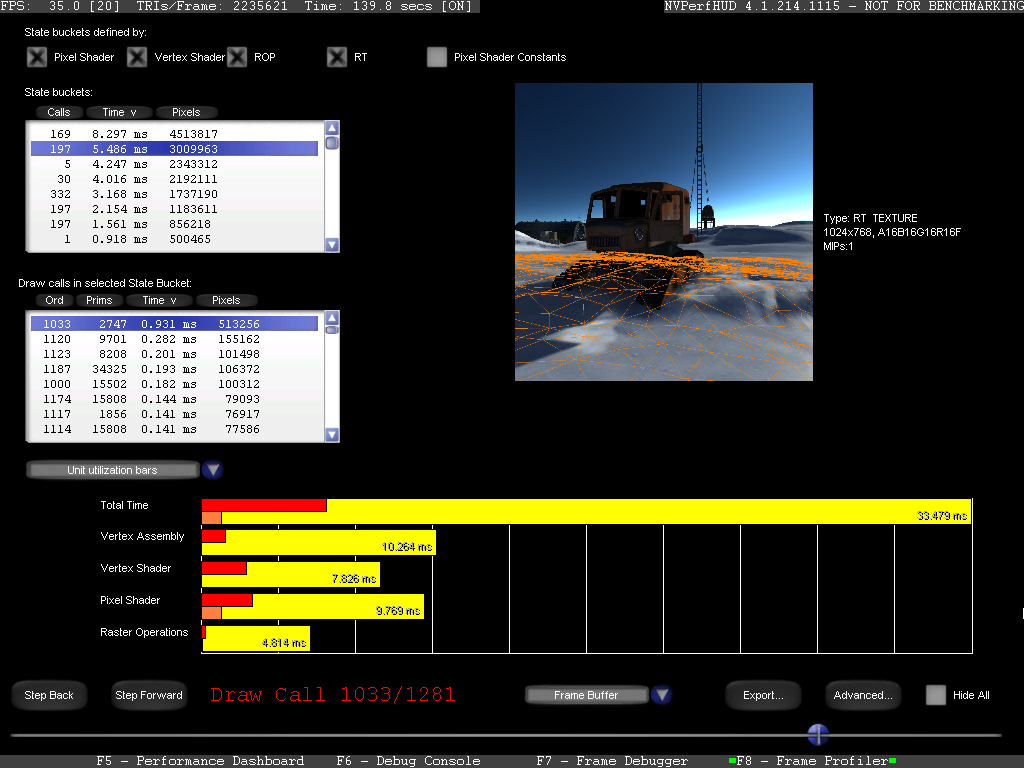
The Performance Dashboard
· A completely customizable real-time graph overlay
· Save/load custom layouts
· Move, resize, and reconfigure your monitors
· Full set of 50+ PerfSDK Direct3D and GPU counters available
· Double-clicking color swatch in graph legend toggles display of that channel
The Frame Debugger
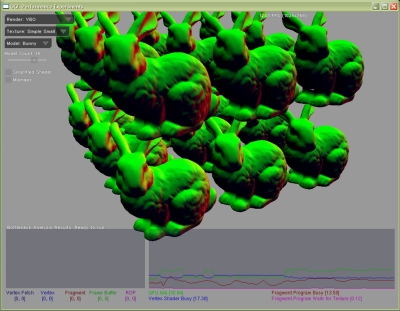
· Texture View
· Visualization of 2D textures, 3D textures, shadow maps, cube maps and render targets
· Full screen texture/render target visualization
· Texture Overrides: Replace your applications textures with mipmap visualizers or other debug textures all on a per-texture basis.
· API Call List
· A color-coded interactive list of every API call made in the frame.
· Dependency View
· View dependencies between draw calls.
· Improved D3D Perf Event View
· Navigate your frame using D3D Perf Events
· Set a debug break on any Perf Event
· Disable PerfHUD modifications in Perf Event ranges.
· Advanced State Inspectors
· Visually inspect all data in the graphics pipeline on a per-draw call basis.
· Edit & Continue for HLSL and .fx vertex, geometry, and pixel shaders
· Edit & Continue for Raster Operations state
The Frame Profiler
· Automated Performance Analysis
· Per-draw call graphs
· CPU and GPU Timings Graph
· Instruction Count Ratio graphs
Improved User Interface
· Numerous new hotkeys
· Keyboard accelerators for context menus
· Instant Feedback (F4) to send the PerfHUD team comments or issues from within the application.
Compatibility, stability, and reliability improvements
· True frame capture
· Extensive testing on a wide range of applications
· Allow API specification (DX9/DX10/both) for apps that create devices from both APIs


 Windows XP and above
 View Screenshots(3)
 Comments
 Download


 Similar Software
 Recently Searched
 Software Categories
 Trending Software


 Like Us


