
ParaView Description
ParaView is an open-source software application that makes use of qualitative and quantitative techniques in order to explore large sets of data in an interactive 3D environment or programmatically using scripting and batch processing capabilities.
Processing scientific data
During a visualization process the program takes raw data and converts it to an understandable format in 2D or 3D space, more specifically a visualization pipeline. In order to visualize your data three steps need to be followed: reading, filtering and rendering. The analysis of large datasets is done via distributed memory computing resources.
Library components
The utility uses the Visualization Tool Kit (VTK) libraries where data objects can be scientific datasets (rectilinear grids or finite element meshes) or abstract data structures such as graphs or trees. Datasets consist of mesh (topology and geometry) and attributes.
User interface
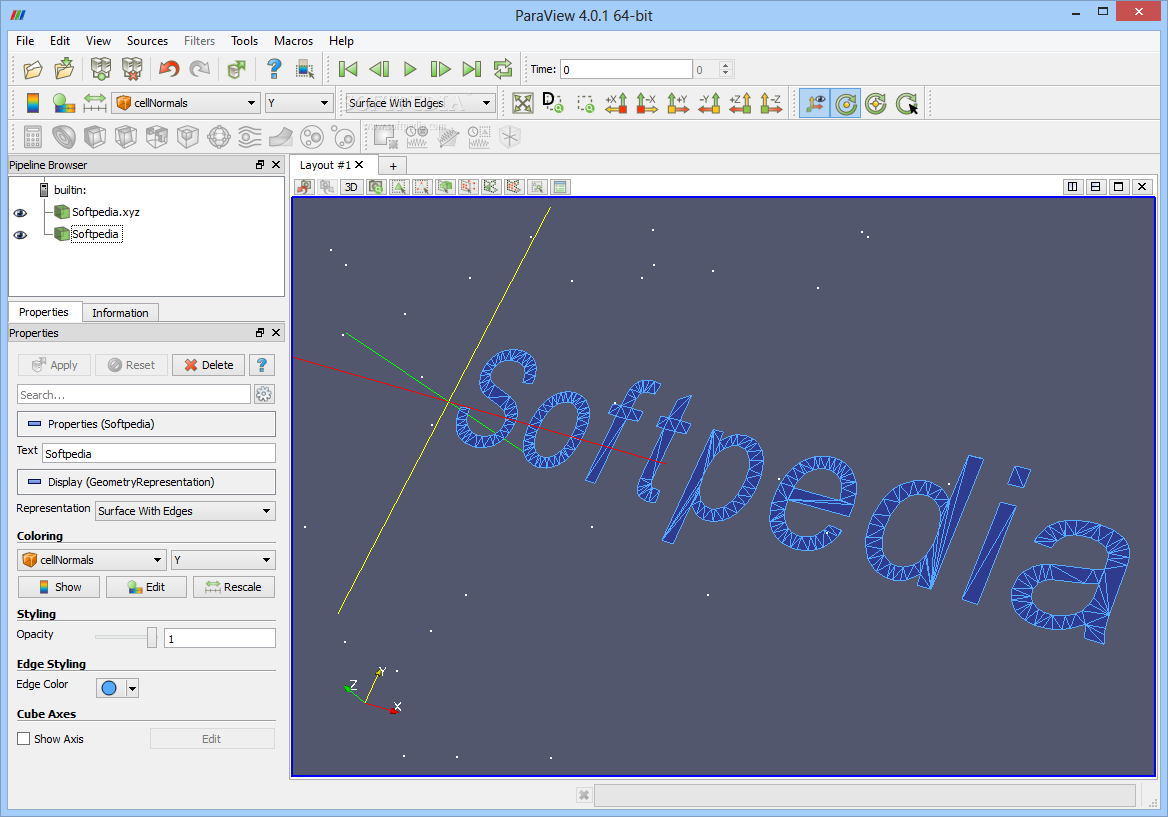
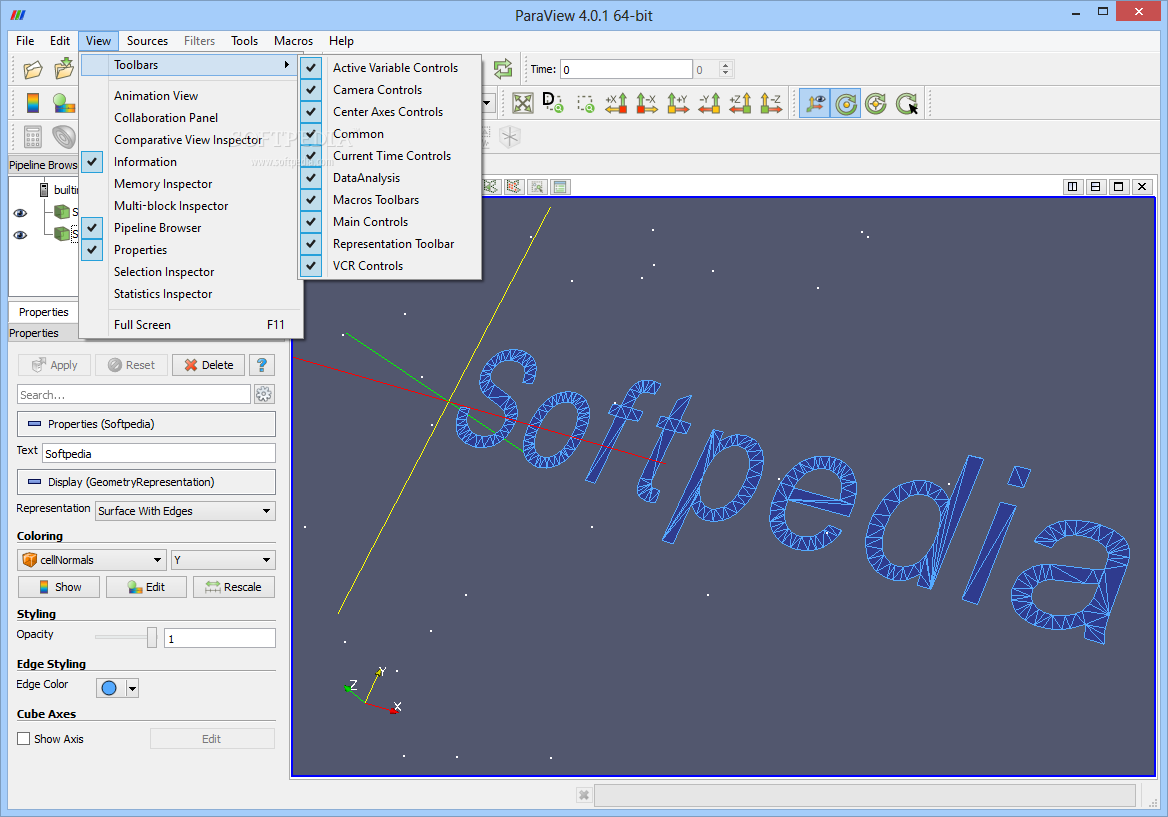
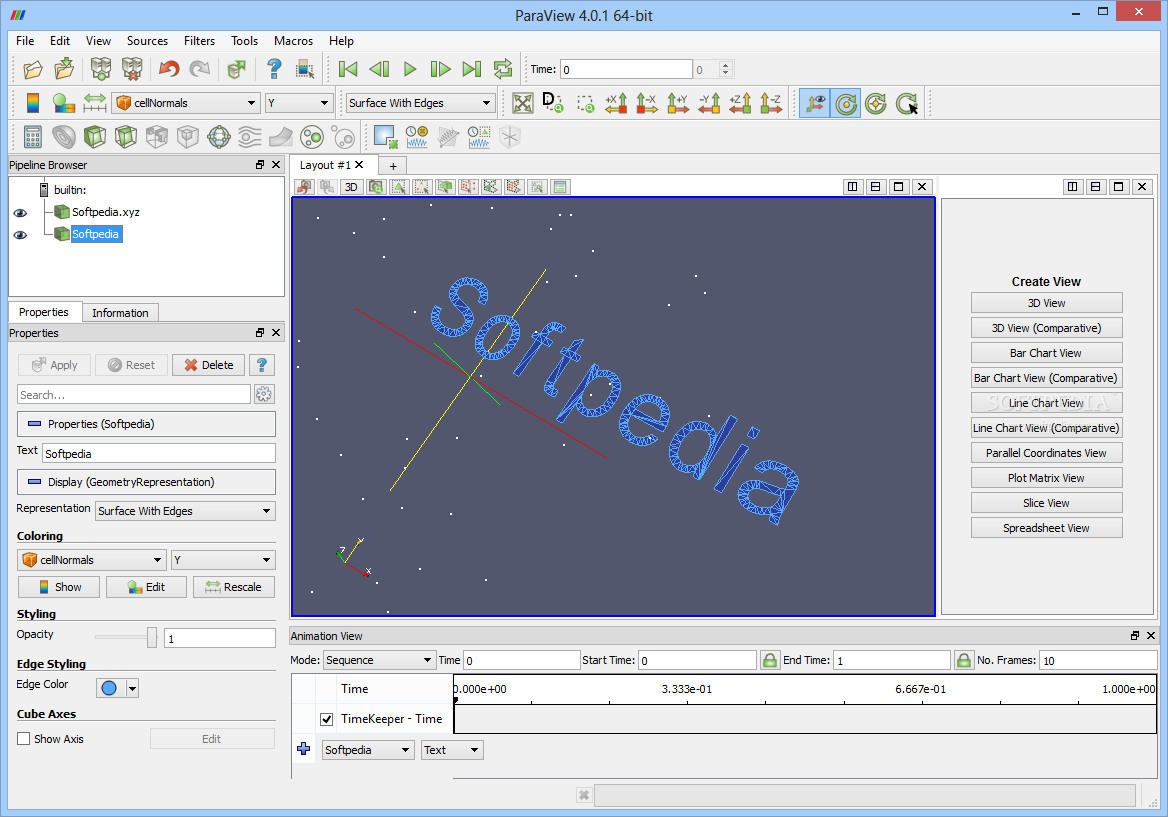
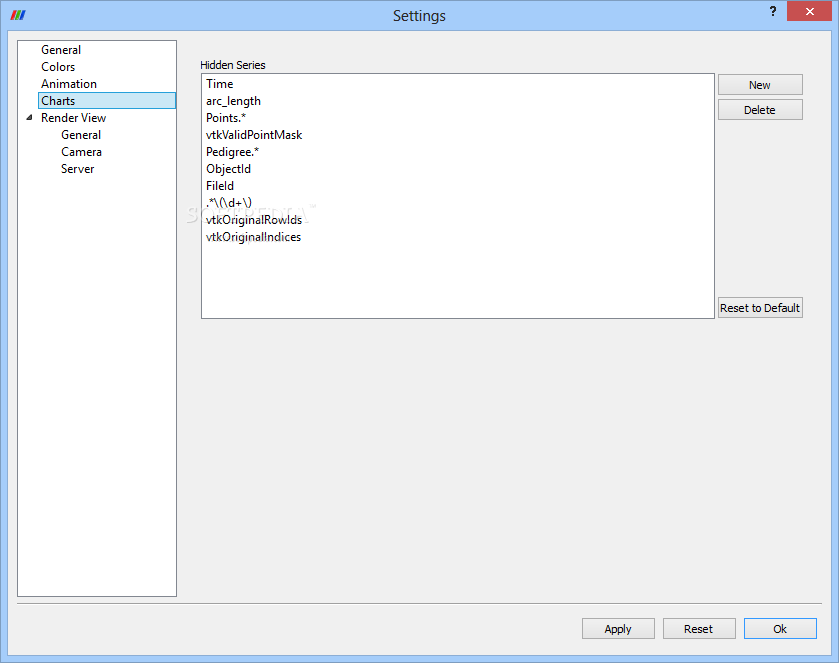
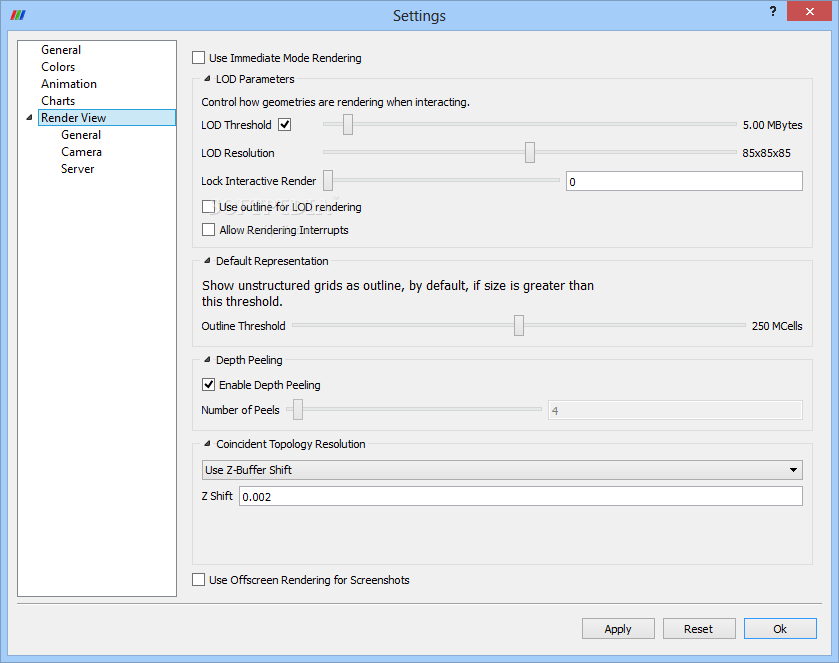
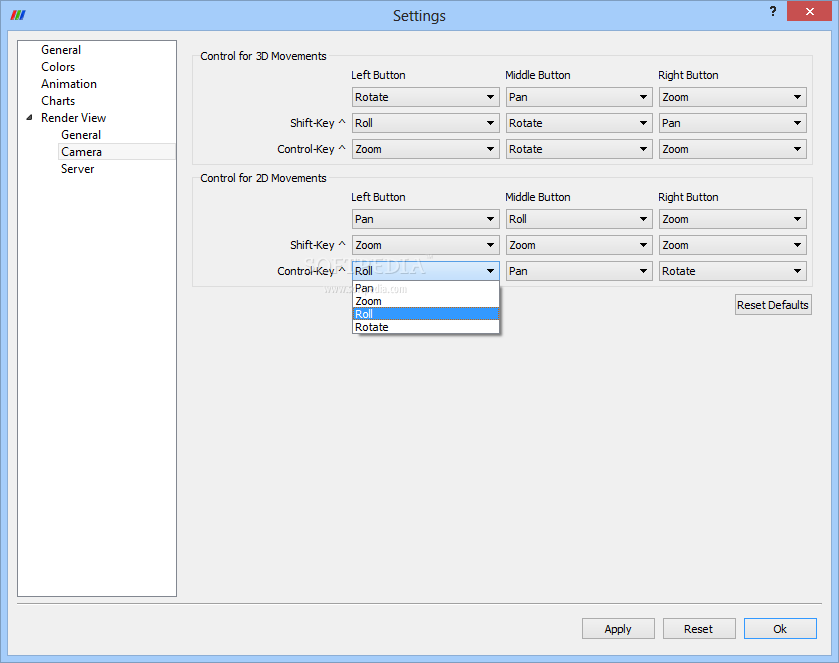
The tool sports a clean and user-friendly layout with well-organized commands in the main window so you can quickly process data. It integrates a multitude of dedicated parameters and configuration settings, so reading the help manual and experimenting with the built-in features can get you out of trouble.
File and Filter menus give you the possibility to open files and manipulate data, while the Pipeline browser is used for revealing the pipeline visualization. The Properties panel enables you to tweak any given module within the pipeline and the View area is displayed in one or more windows.
Importing and exporting options
ParaView is able to read data from a comprehensive number of file formats, such as INP, CML, CSV, TXT, DEM, DCM, FLASH, NCD, VTK, RES, OBJ, XYZ, DAT, PHT, SAR, RAW, DUMP, JPG, VRT and WIND.
You can take screenshots and save them to PNG, BMP, JPG, PDF or other file format, export the current scene to EPS, PDF, PS, SVG or POV file format, save animation to OVG, PNG or AVI, as well as export geometry to PVD.
General information, statistics and memory inspector
The tool reveals several handy features in the Information panel, namely file properties, data statistics (type, number of cells and points, memory), array data (association, name, type and range of each array in the dataset), bounds (coordinates and dimensions), timesteps (index and value of all time steps available in a file), extents (only for structured datasets), as well as data hierarchy for AMR and multi-block datasets.
The statistics inspector reveals details about the memory used by every pipeline filter or source, while the memory inspector gives you the power to keep an eye on ParaView’s memory usage during interactive visualization through direct queries to the operating system.
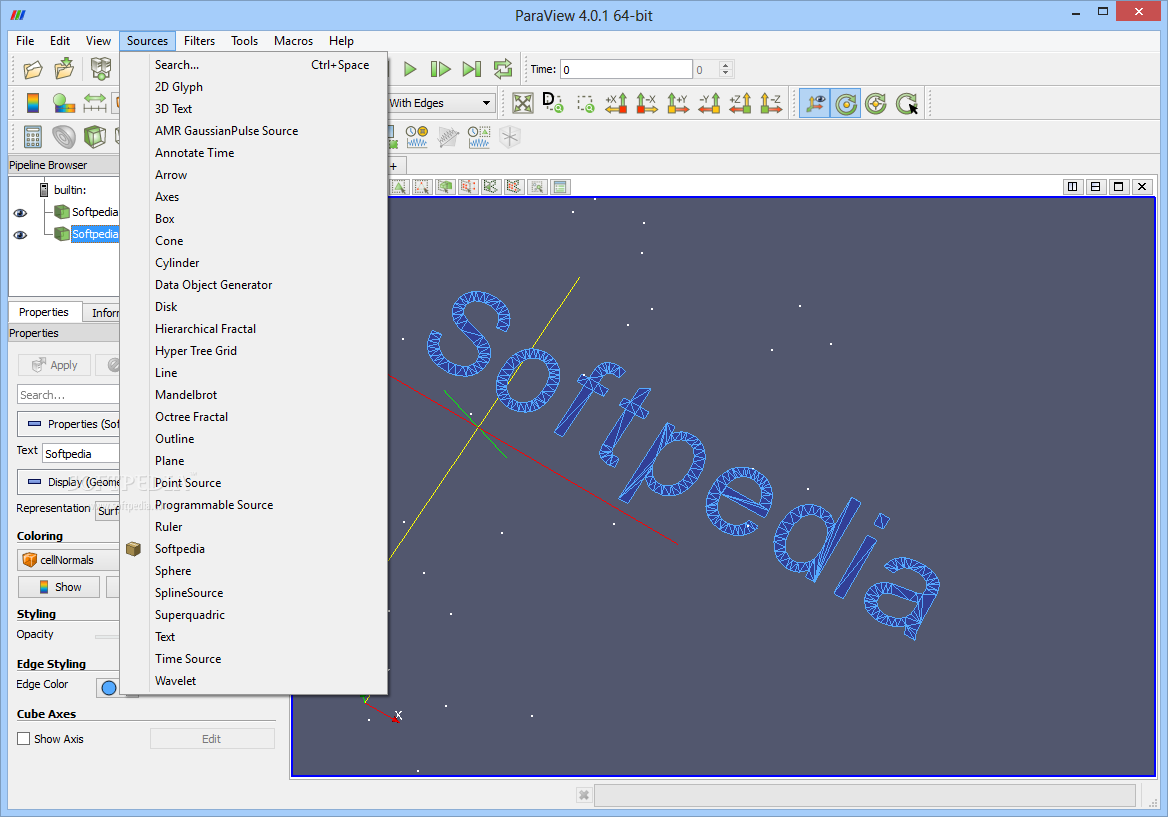
Working with sources, filters and tools
There are many objects that you can place in the working environment, such as 2D glyph, 3D text, arrow, axes, box, cone, cylinder, disk, hierarchical fractal, line, plane, ruler, sphere, and hyper tree grid.
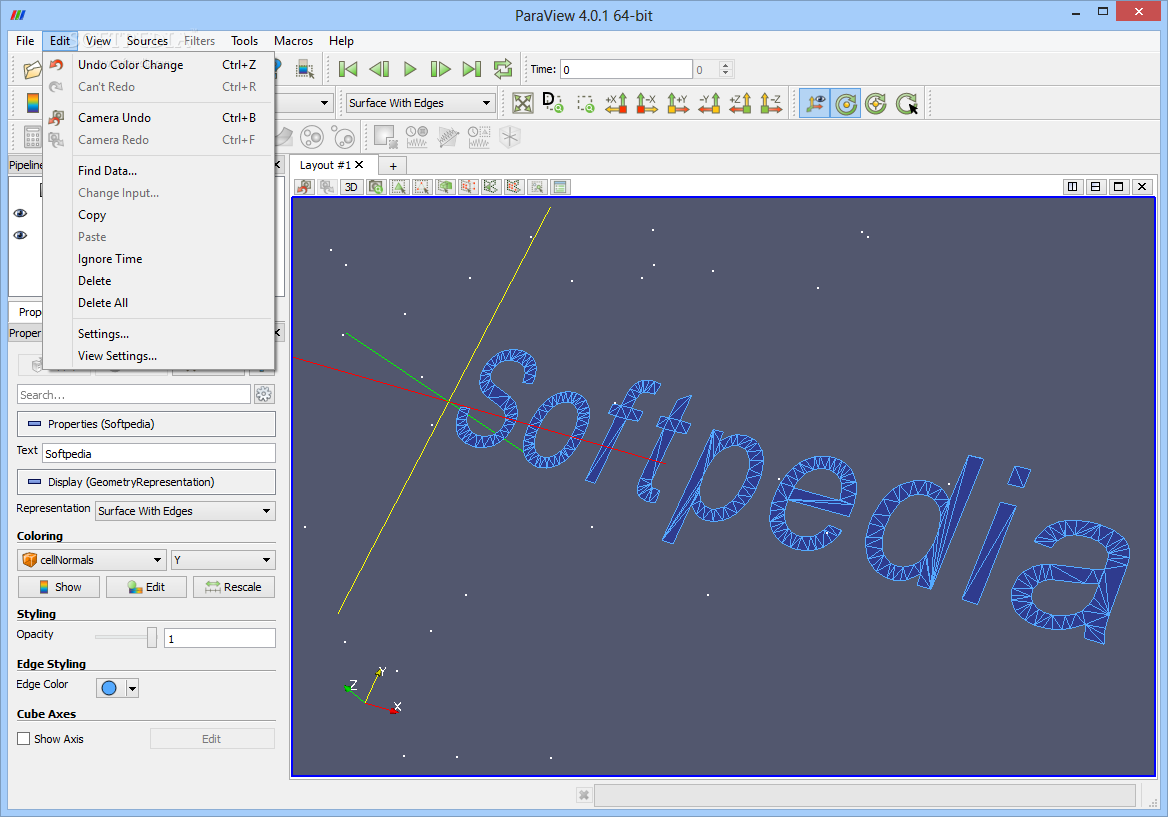
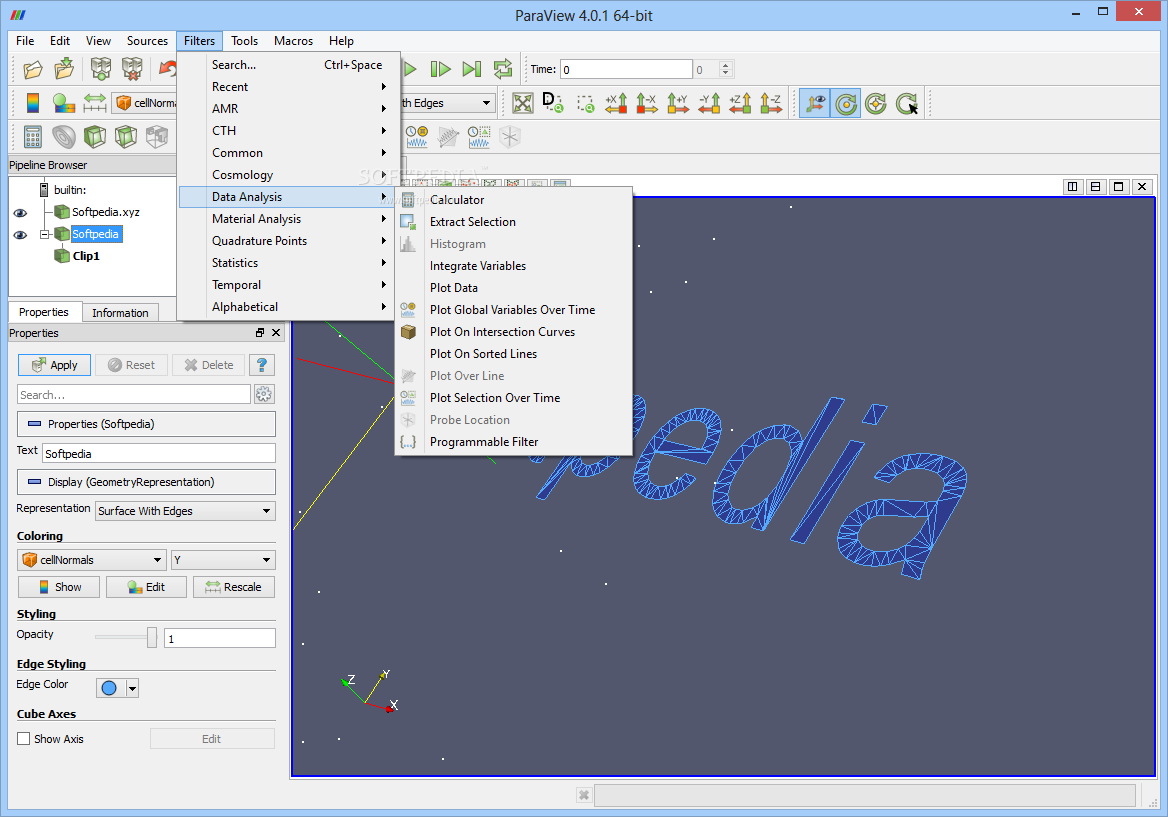
You can choose between a wide range of filters that you can apply to your data, and there are organized in different categories, namely AMR, CTH, Common (e.g. Calculator, Slice, Clip, Contour, Threshold), Data Analysis, Material Analysis, Quadrature Points, Statistics, and Temporal. Additionally, you can make the app display them in an alphabetical order.
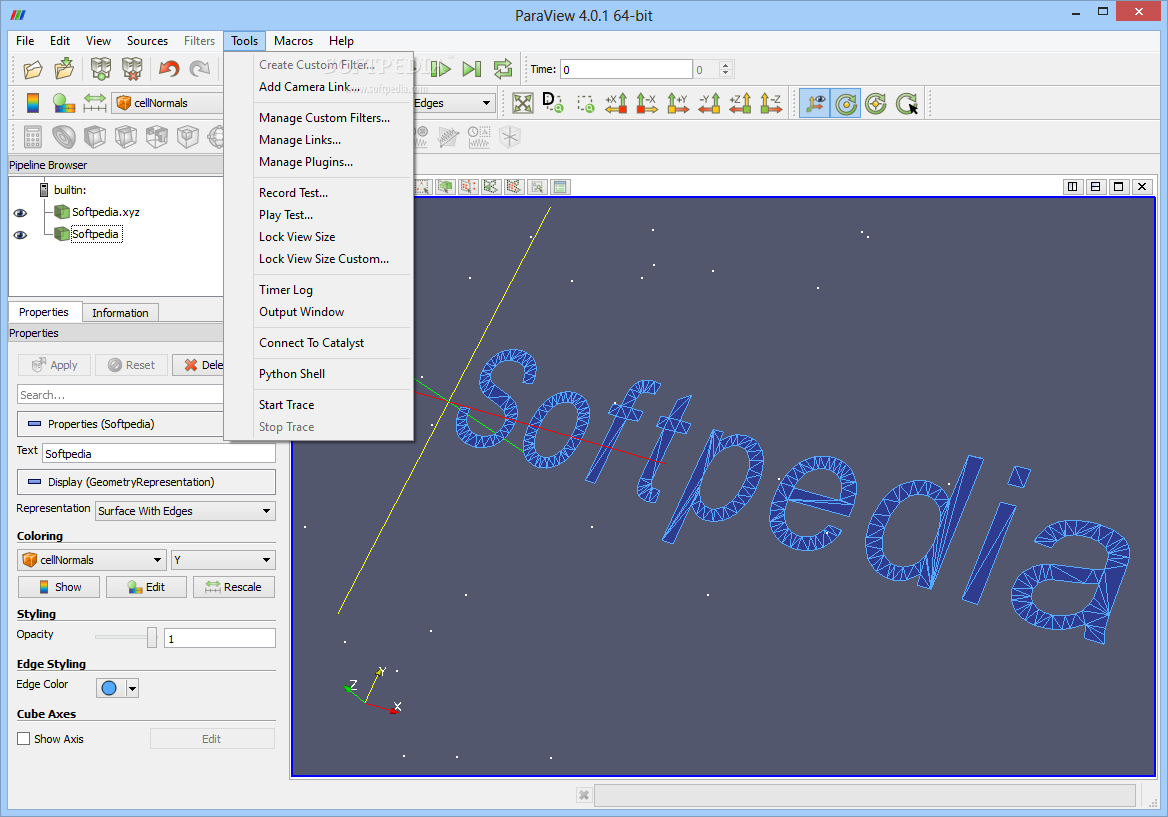
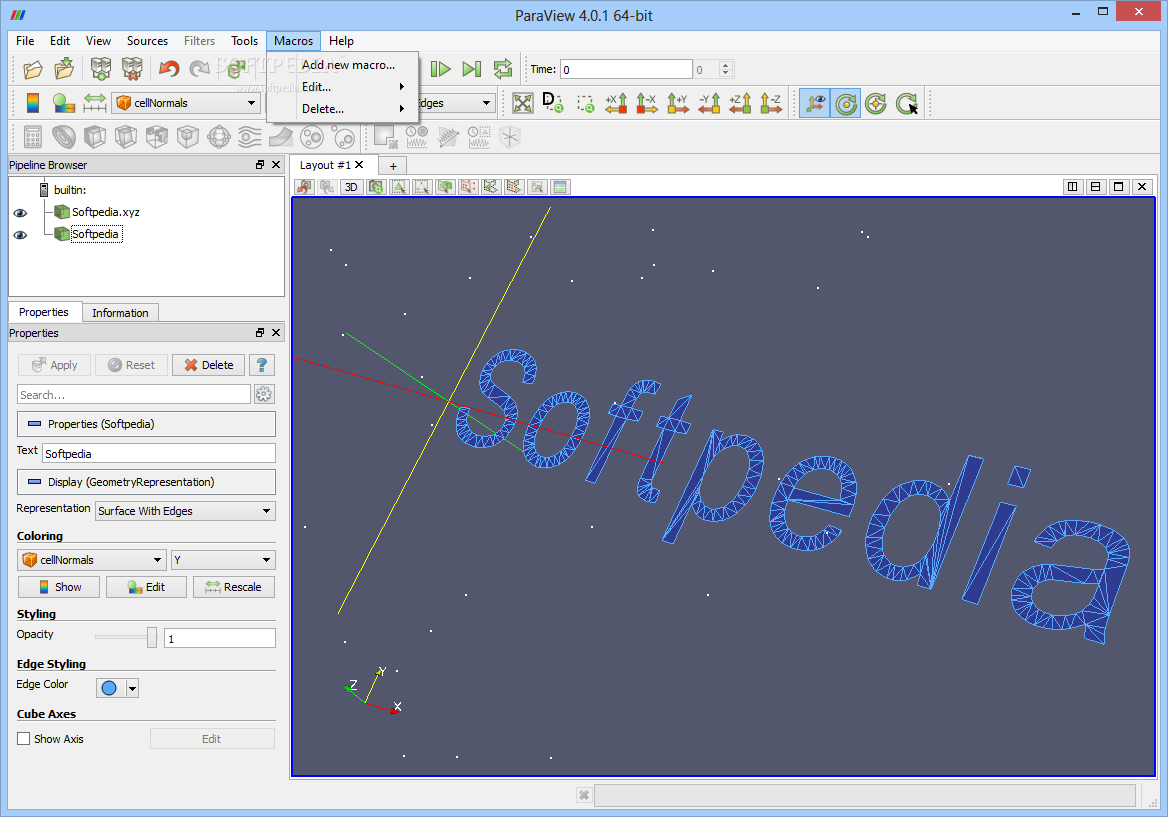
Several tools are implemented in the program for helping you create a custom filter, add camera link, manage plugins, record and play a test, open up the Python shell, as well as import macros from Python scripts.
Other handy features to play with
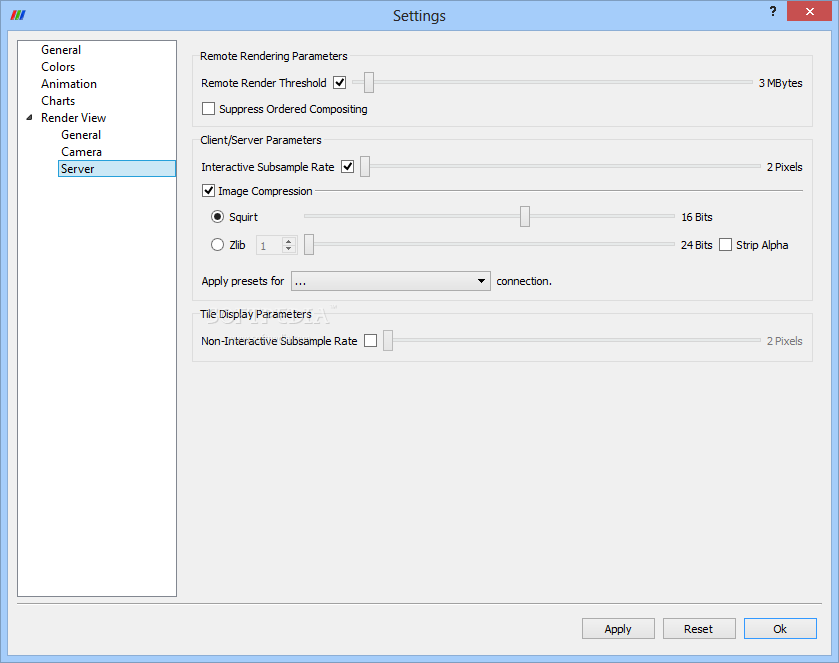
Last but not least, you can work with 3D widgets (e.g. line, plane, sphere), annotate data in the 3D scene, create animations by recording a series of key frames, make use of comparative views mode for displaying results from a parameter study, and create visualizations of large data sets that reside on parallel and remote systems (client, data server and render server combinations).
An overall powerful and efficient CAD app
In conclusion, ParaView proves to be an advanced and reliable data analysis and visualization application, which is suitable especially for power users. ParaView can be run from laptops up to sophisticated and complex computers and workstations, and is one of the best software programs on the market that deals with large data visualization.


 Windows 7 and above
 View Screenshots(16)
 Comments
 Download


 Similar Software
 Recently Searched
 Software Categories
 Trending Software


 Like Us


