Works on: Windows 10 | Windows 8.1 | Windows 8 | Windows 7 | Windows 2012 SHA1 Hash: 9eca71387dd48fbf2588bcbeb20a5df1efaf17f3 Size: 5.37 MB File Format: zip
Rating: 2.739130434
out of 5
based on 23 user ratings
Publisher Website: External Link Downloads: 1810 License: Free
PAST is a free software by Oyvind Hammer and works on Windows 10, Windows 8.1, Windows 8, Windows 7, Windows 2012.
You can download PAST which is 5.37 MB in size and belongs to the software category Science CAD. PAST was released on 2017-03-06 and last updated on our database on 2017-04-23 and is currently at version 3.15.
Thank you for downloading from SoftPaz! Your download should start any moment now. It would be great if you could rate and share:
Rate this software:
Share in your network:
PAST Description
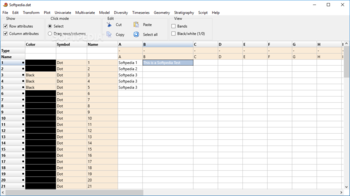
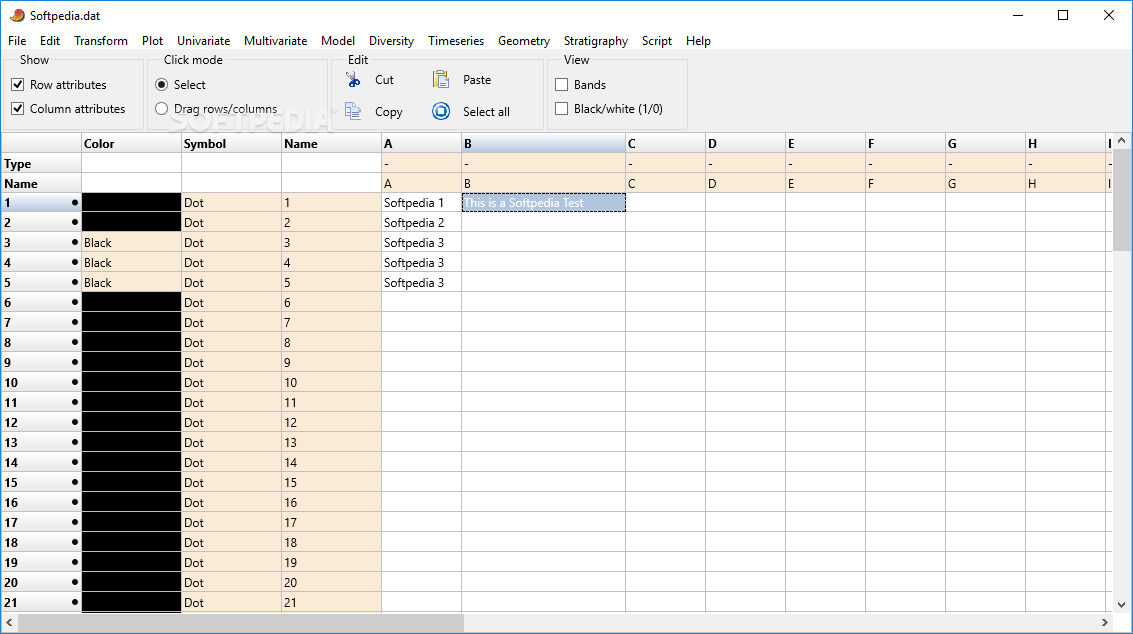
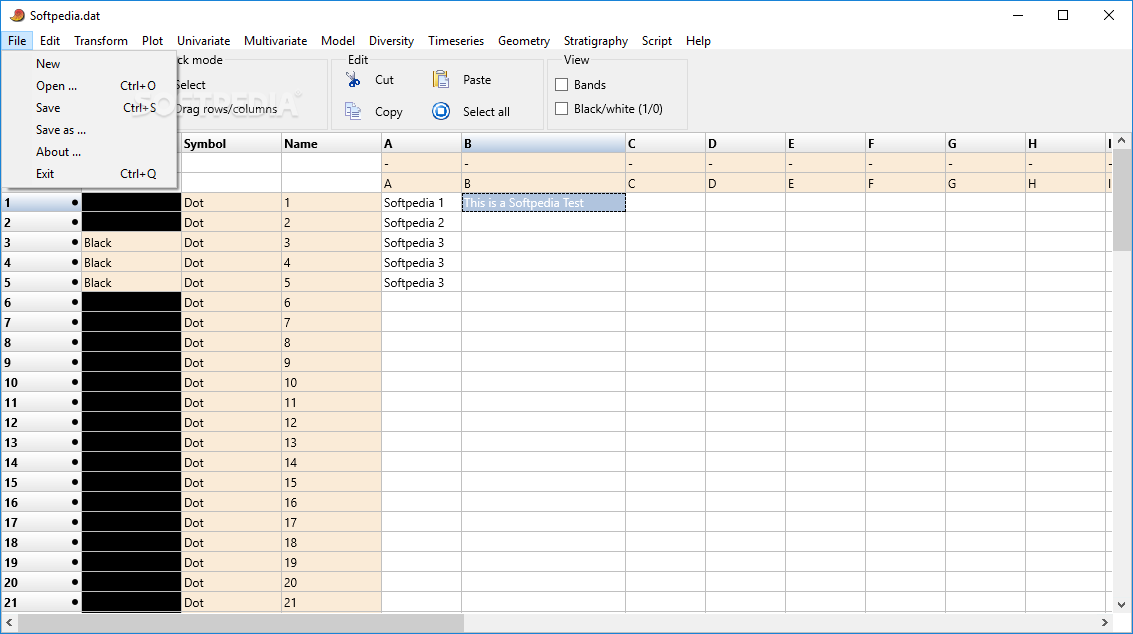
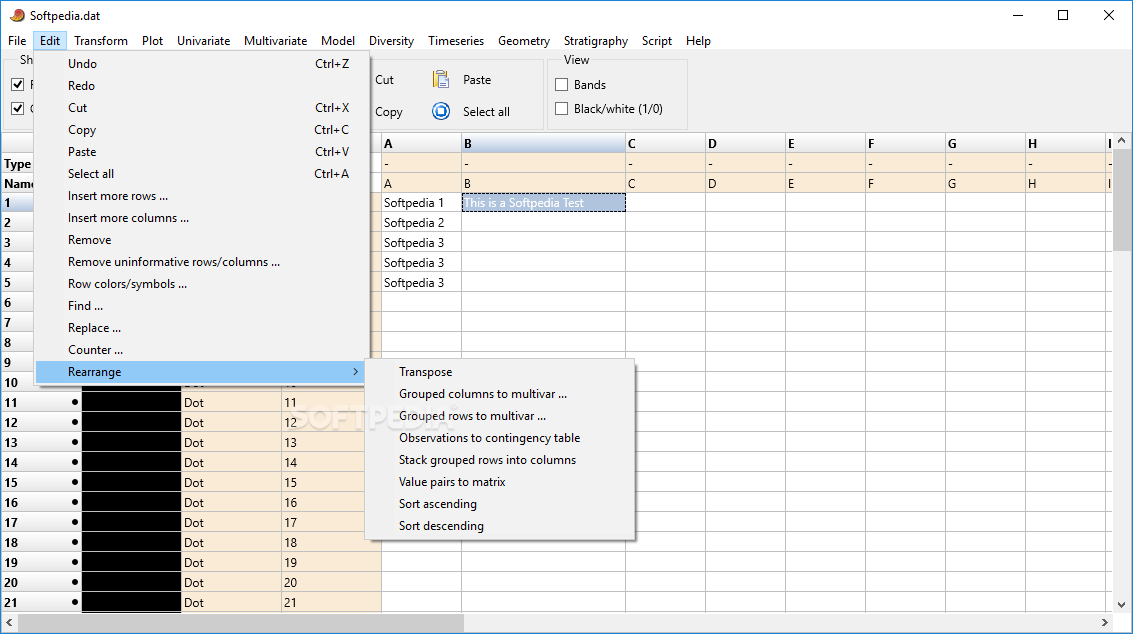
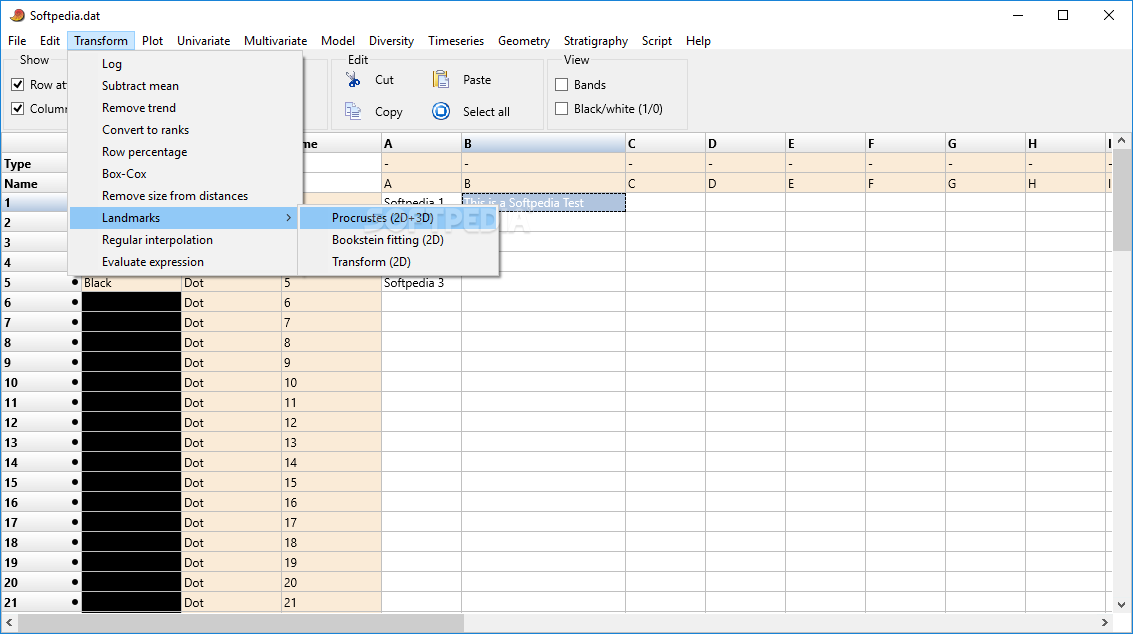
A spreadsheet-type data entry form
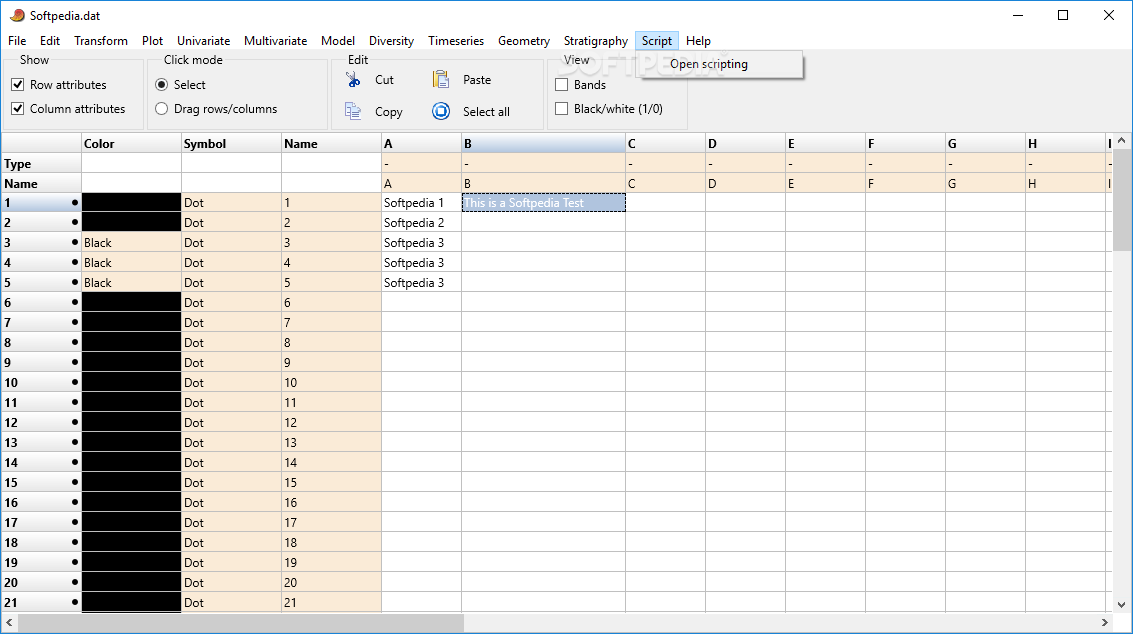
Both interactive user interface and scripting
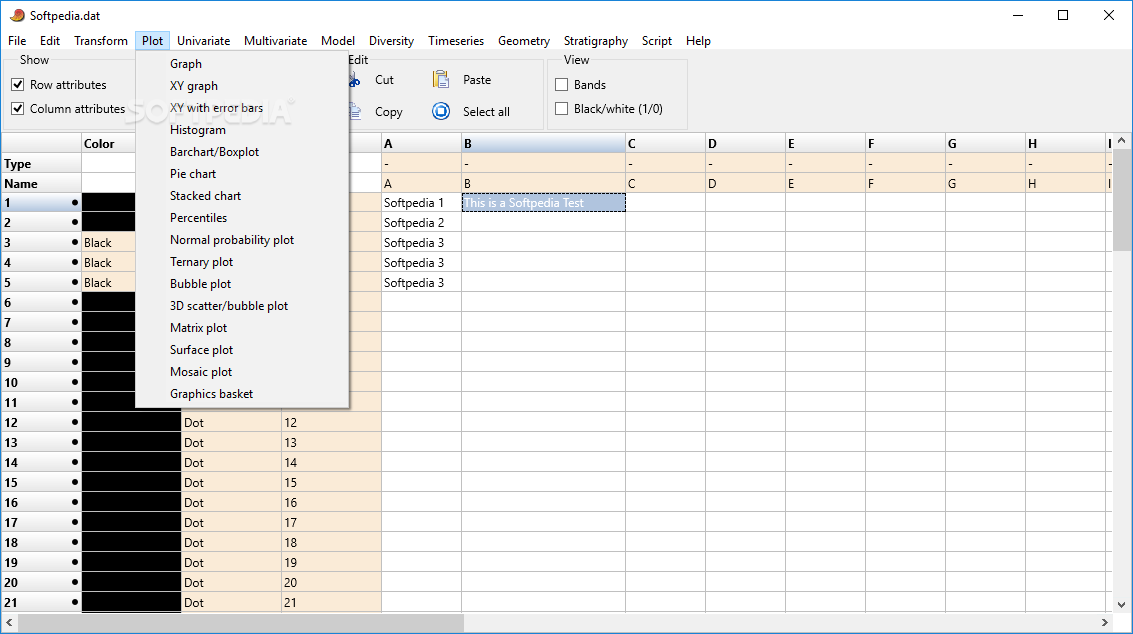
Graph, scatter, 3D scatter, bubble, histogram, kernel density estimation, box, percentile, ternary, survivorship, spindle, matrix, surface and normal probability plots
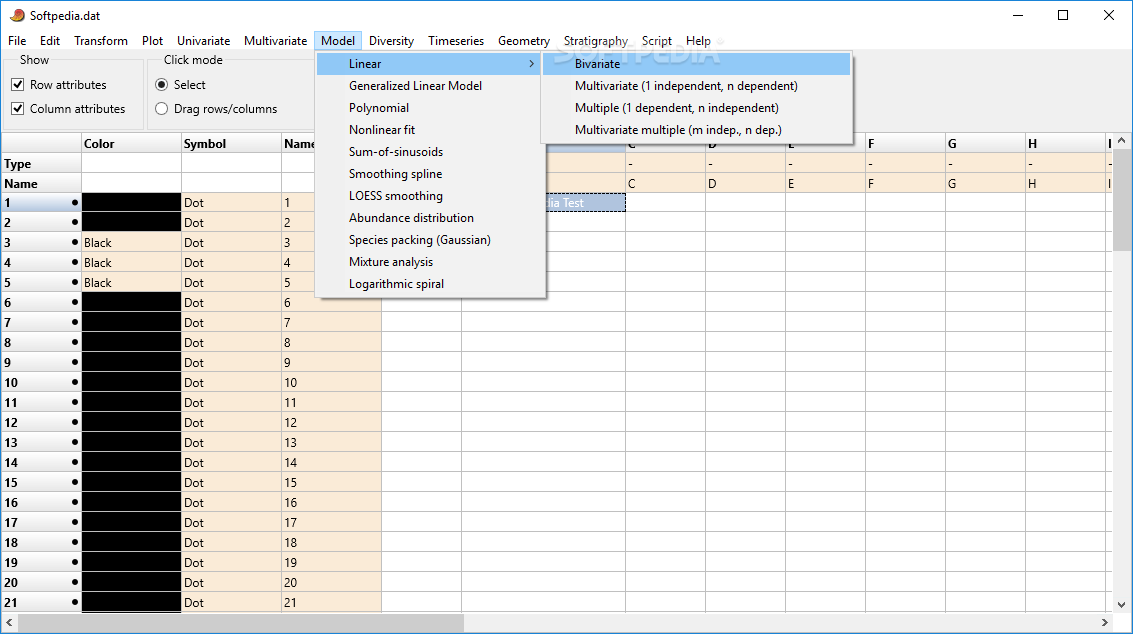
Curve fitting: Linear (Standard and Reduced Major Axis) with bootstrapping and permutation, lin-log (exponential), log-log (allometric), polynomial, logistic, von Bertalanffy, sum-of-sines, smoothing splines, LOESS smoothing, Gaussian (species packing), multiple regression.
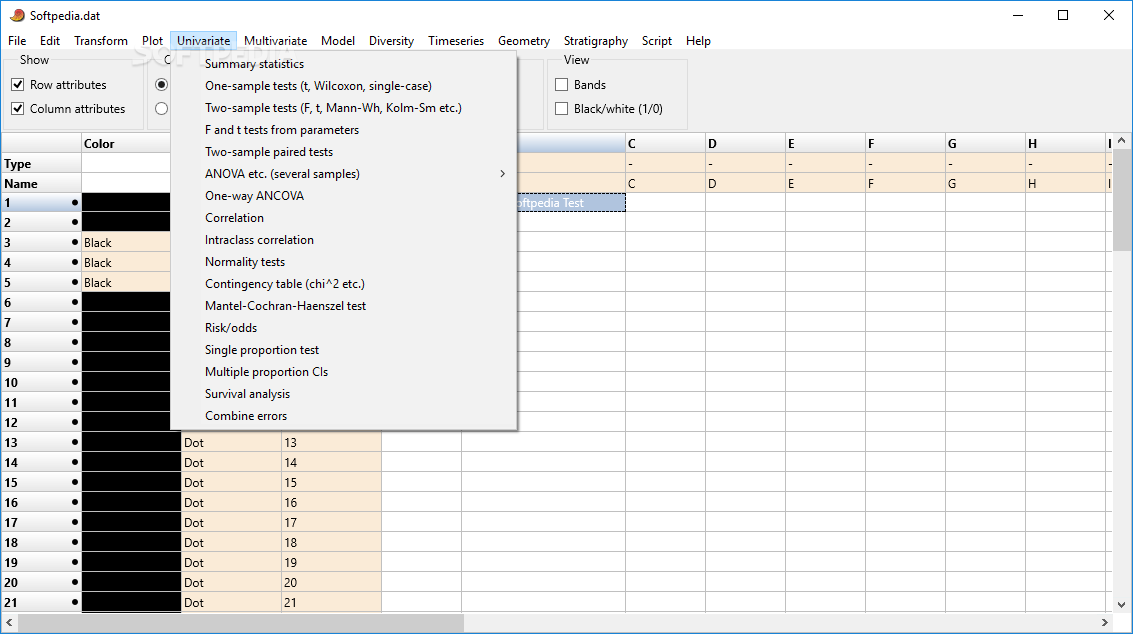
F, t, permutation t, Chi-squared w. permutation test, Fisher's exact, Kolmogorov-Smirnov, Mann-Whitney, Shapiro-Wilk, Jarque-Bera, Spearman's Rho and Kendall's Tau tests with permutation, correlation, covariance, contingency tables, one-way and two-way ANOVA, one-way ANCOVA, Kruskal-Wallis test, sign test, Wilcoxon signed rank test with permutation, Fligner-Killeen test for coefficients of variation, mixture analysis, survival analysis (Kaplan-Meier curves, logrank and other tests), risk difference/risk ratio/odds ratio with tests.
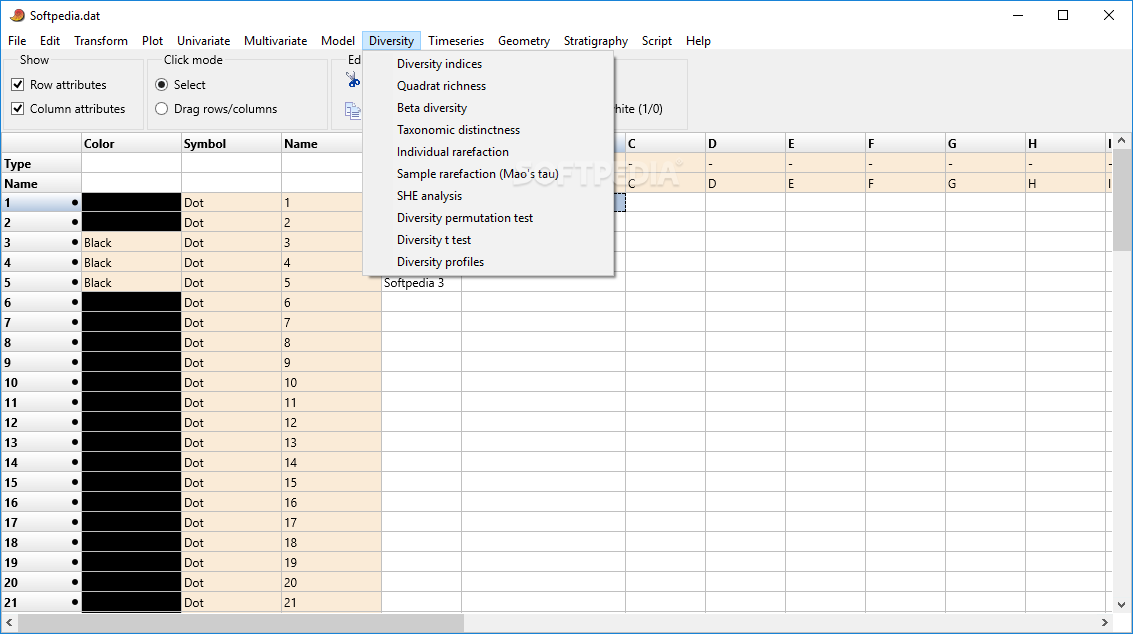
Diversity indices with bootstrapping and permutation, individual- and sample-based rarefaction. Capture-recapture richness estimators. Renyi diversity profiles, SHE analysis, beta diversity.
Abundance model fitting: Geometric, log-series, log-normal, broken stick.
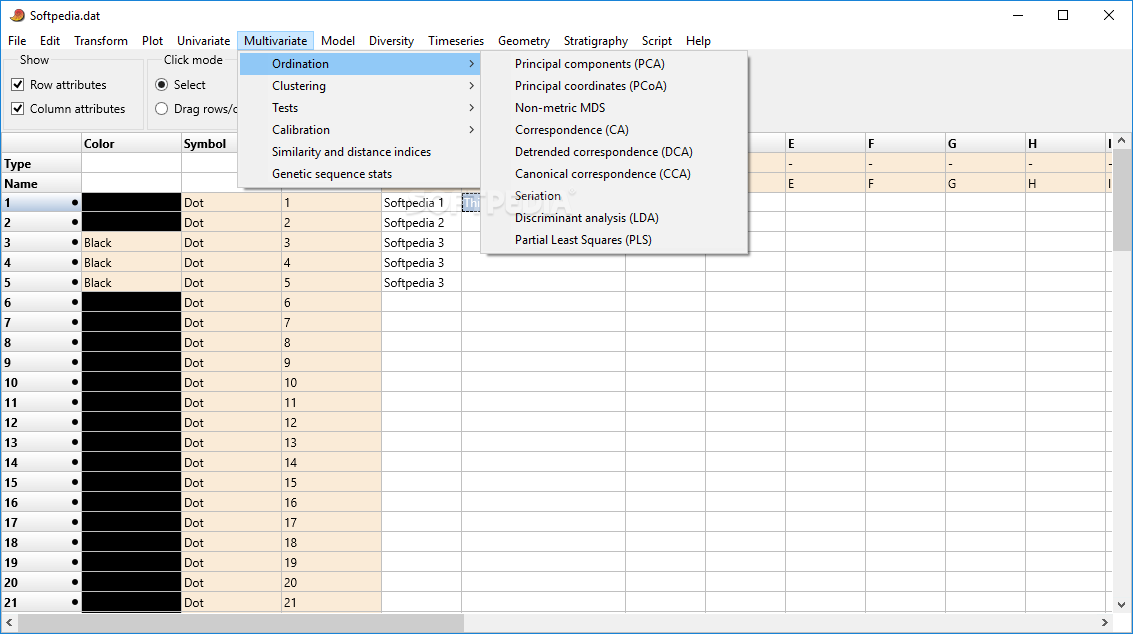
Multivariate statistics: Principal Components (with Minimal Spanning Tree, bootstrapping etc.), Principal Coordinates (19 distance measures), Non-metric Multidimensional Scaling (19 distance measures), Detrended Correspondence Analysis, Canonical Correspondence Analysis, Cluster analysis (UPGMA, single linkage, Ward's method and neighbour joining, 19 distance measures, two-way clustering, bootstrapping), k-means clustering, seriation, discriminant analysis, one-way MANOVA, one-way and two-way ANOSIM, one-way NPMANOVA, Hotelling's T2, paired Hotelling's T2, Mahalanobis-distance permutation, Mardia's multivariate normality, Box's M, Canonical Variates Analysis, multivariate allometry with bootstrapping, Mantel test, SIMPER, Imbrie & Kipp factor analysis, Modern Analog Technique, two-block Partial Least Squares.
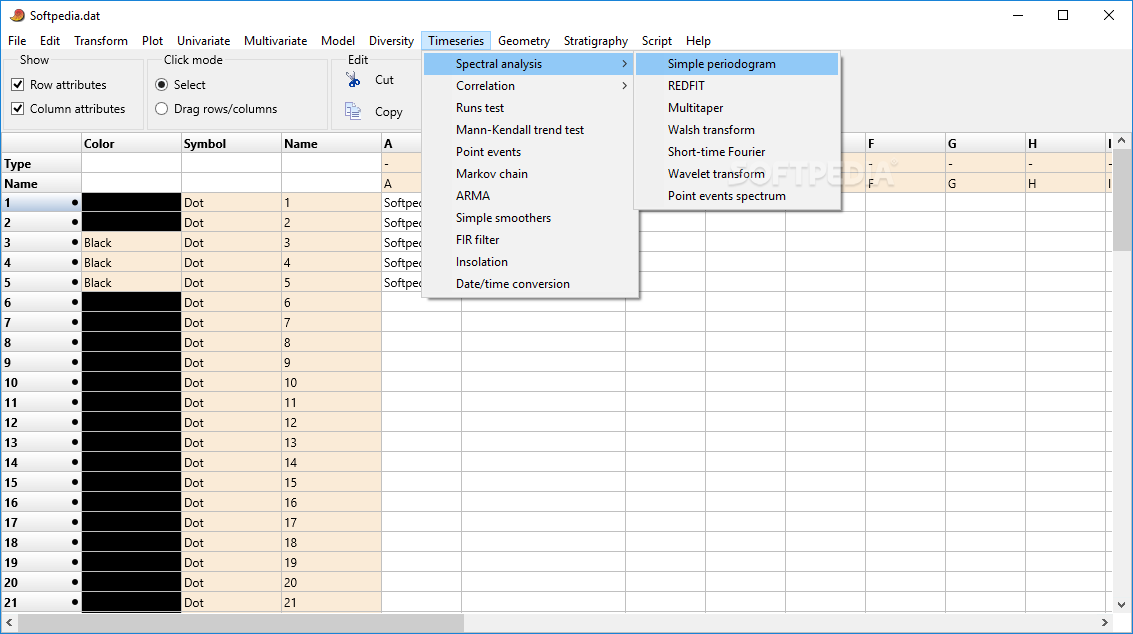
Time series analysis: Spectral analysis, autocorrelation, cross-correlation, wavelet transform, Walsh transform, runs test. Mantel correlogram and periodogram. ARMA, Box-Jenkins intervention analysis. Solar forcing model.
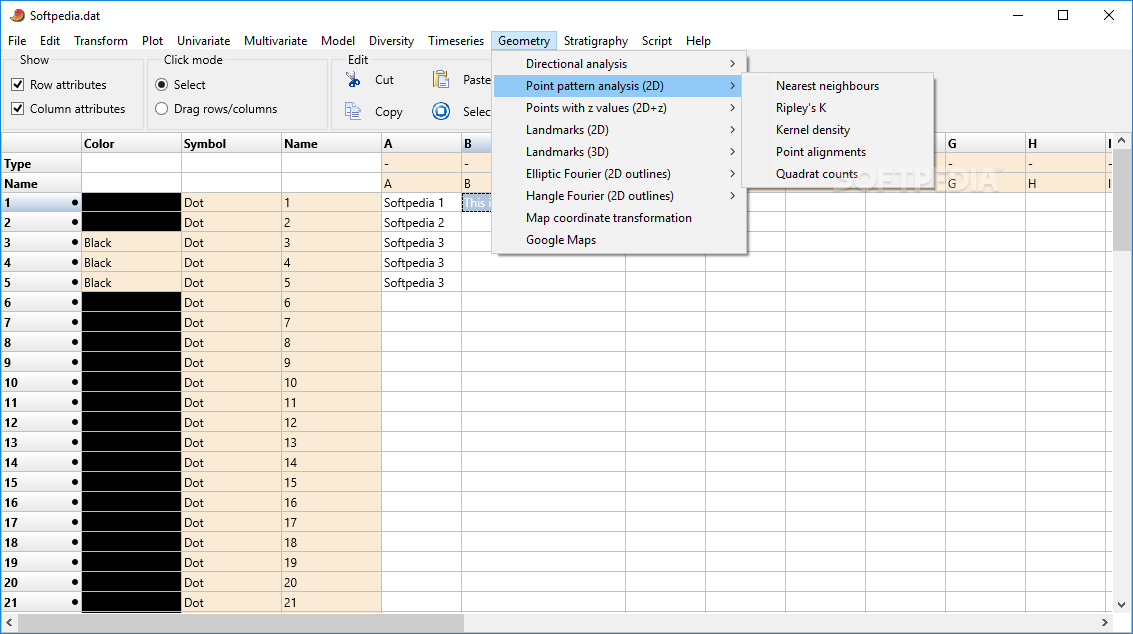
Geometrical analysis: Directional statistics (Rayleigh, Rao, chi-squared, Watson-Williams, circular kernel density estimation, angular mean with CI, rose plots, circular correlation), kernel density estimation of point density, point distribution statistics (nearest neighbour and Ripley's K), Fourier shape analysis, elliptic Fourier shape analysis, eigenshapes, landmark analysis with Bookstein and Procrustes fitting (2D and 3D), thin-plate spline transformation grids with expansions and principal strains, partial warps and scores, relative warps and scores, centroid size from landmarks, size removal by Burnaby's method.
Parsimony analysis (cladistics): Exhaustive, branch-and-bound and heuristic algorithms, Wagner, Fitch and Dollo characters. Bootstrap, strict and majority rule consensus trees. Consistency and retention indices. Three stratigraphic congruency indices with permutation tests. Cladograms and phylograms.
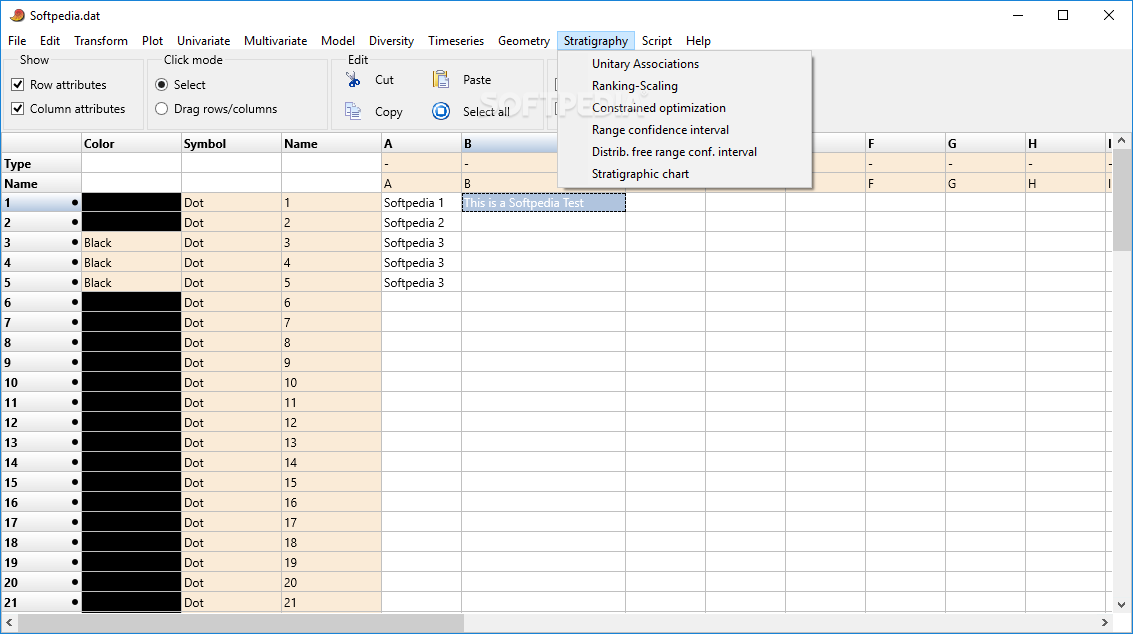
Biostratigraphy with the methods of Unitary Associations, Ranking-Scaling (RASC), Appearence Event Ordination and Constrained Optimization (CONOP). Confidence intervals on stratigraphic ranges.
Gridding (spatial interpolation): Moving average, thin-plate spline and kriging with three semivariogram models.


 Windows 7 and above
 View Screenshots(13)
 Comments
 Download


 Similar Software
 Recently Searched
 Software Categories
 Trending Software


 Like Us


