Works on: Windows 10 | Windows 8.1 | Windows 8 | Windows 7 | Windows 2012 SHA1 Hash: 46827fd2c66b0d54c83ace8ba03e7e54718c848f Size: 790.58 KB File Format: zip
Rating: 1.913043478
out of 5
based on 23 user ratings
Downloads: 1364 License: Free
Plotter is a free software by Valter Kiisk and works on Windows 10, Windows 8.1, Windows 8, Windows 7, Windows 2012.
You can download Plotter which is 790.58 KB in size and belongs to the software category Science CAD. Plotter was released on 2015-01-10 and last updated on our database on 2017-04-04 and is currently at version 2.7.
Thank you for downloading from SoftPaz! Your download should start any moment now. It would be great if you could rate and share:
Rate this software:
Share in your network:
Plotter Description
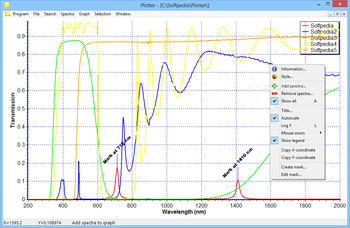
For those who work with various spectra, they can be difficult to compare directly without specialist equipment. Plotter is an application that allows user to compare different wavelengths by plotting them on a graph automatically for study, assuming they are stored correctly in the ASCII format.
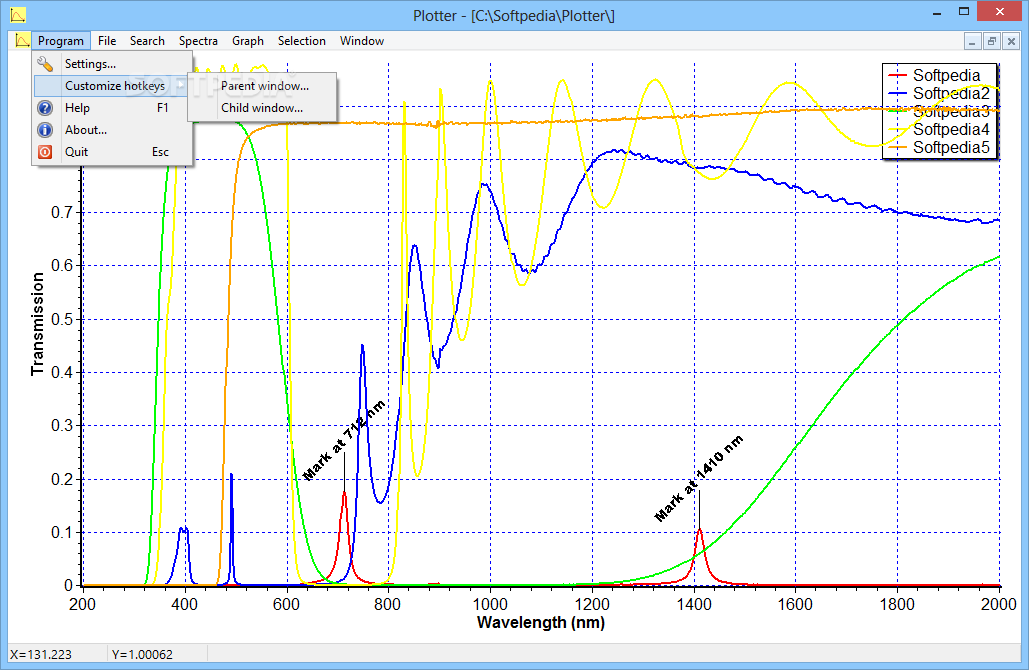
An intuitive graph exploring system that is very natural and simple to operate
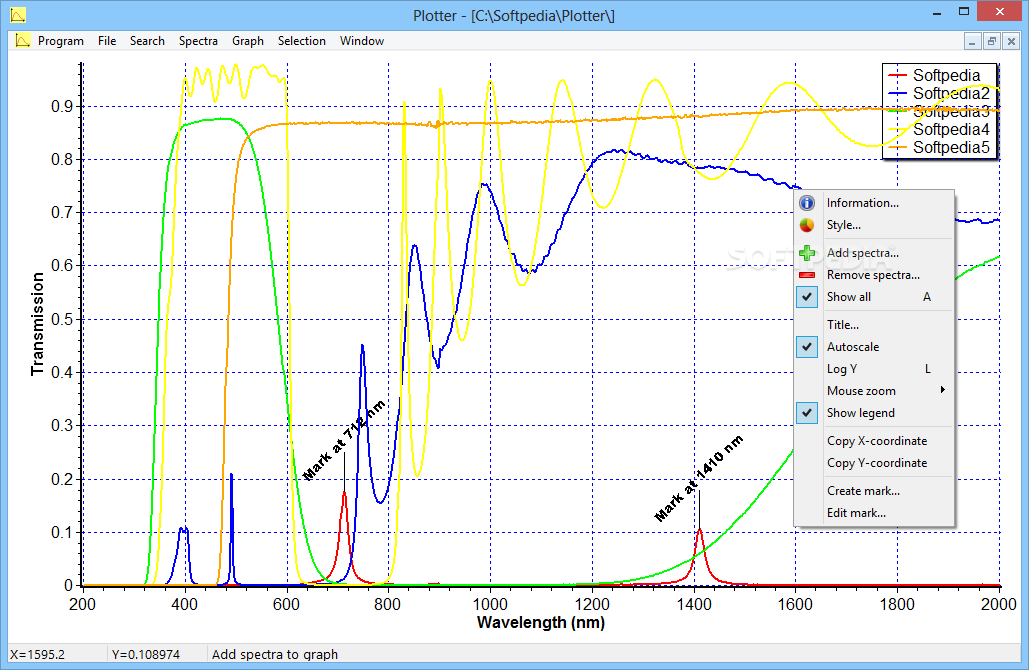
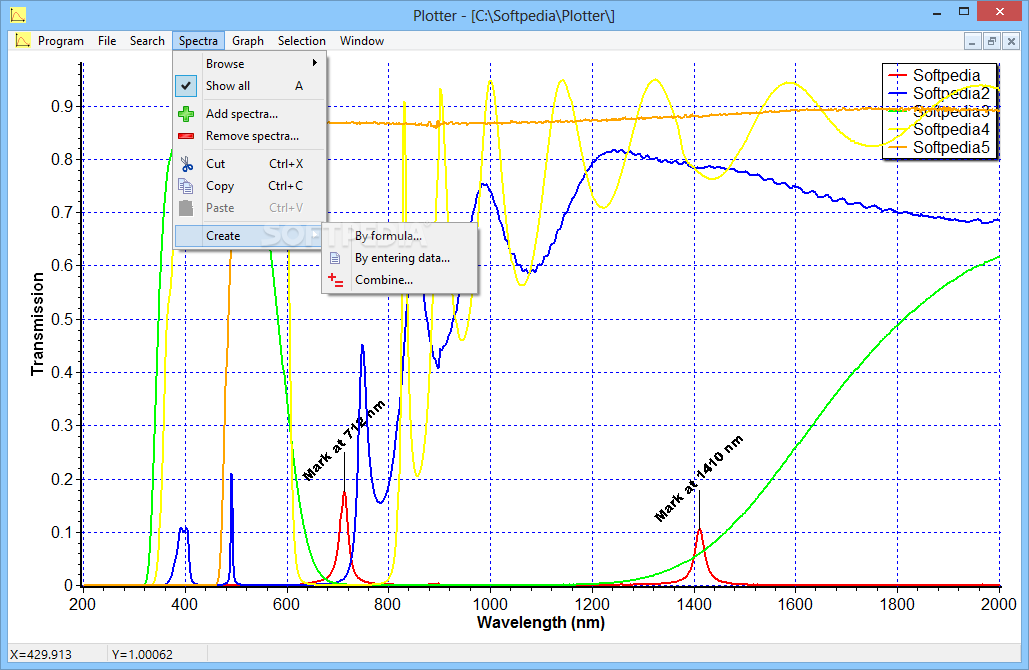
The main feature of Plotter is its ability to display wavelength spectra on a graph by converting them from the ASCII format, once they are on the graph, the program presents them well. Each wavelength can be represented by a different color, entirely customizable, with a useful zoom in feature.
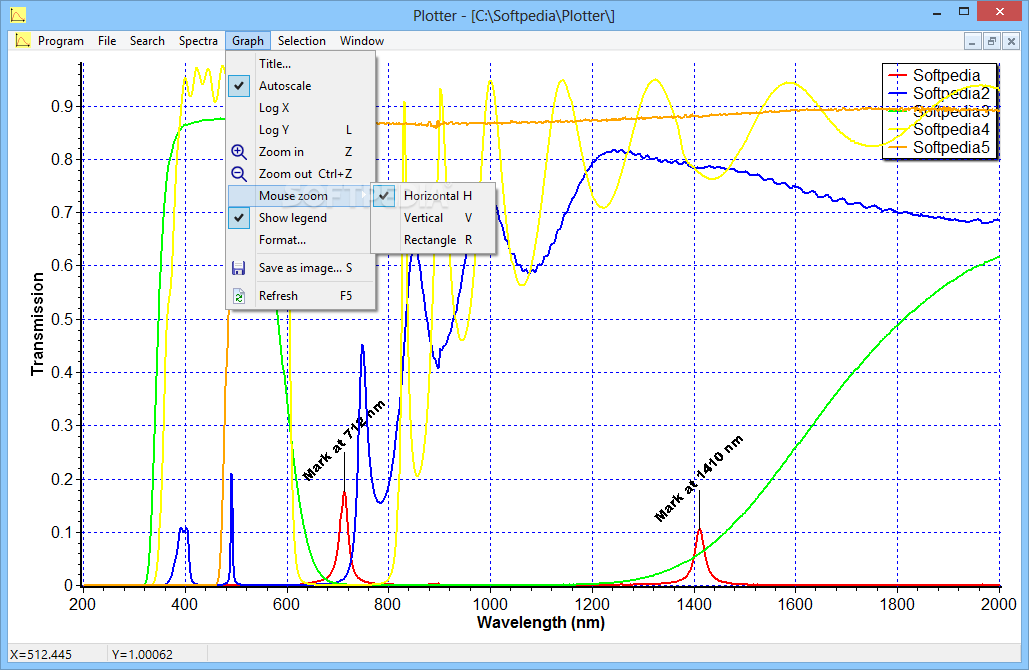
Users can zoom in on an area and dragging a box over the area of interest, the graph automatically adjusts the scale for that area to fit the entire graph. To zoom out, simply draw a box in the opposite direction. At first it seems odd, but once users get the hang of the system they will find how quick and intuitive it is to operate. The changing of the axis scale makes the interactive zoom far superior to a regular enlarging option.
A useful range of features and mathematical support options, including different spectroscopy settings
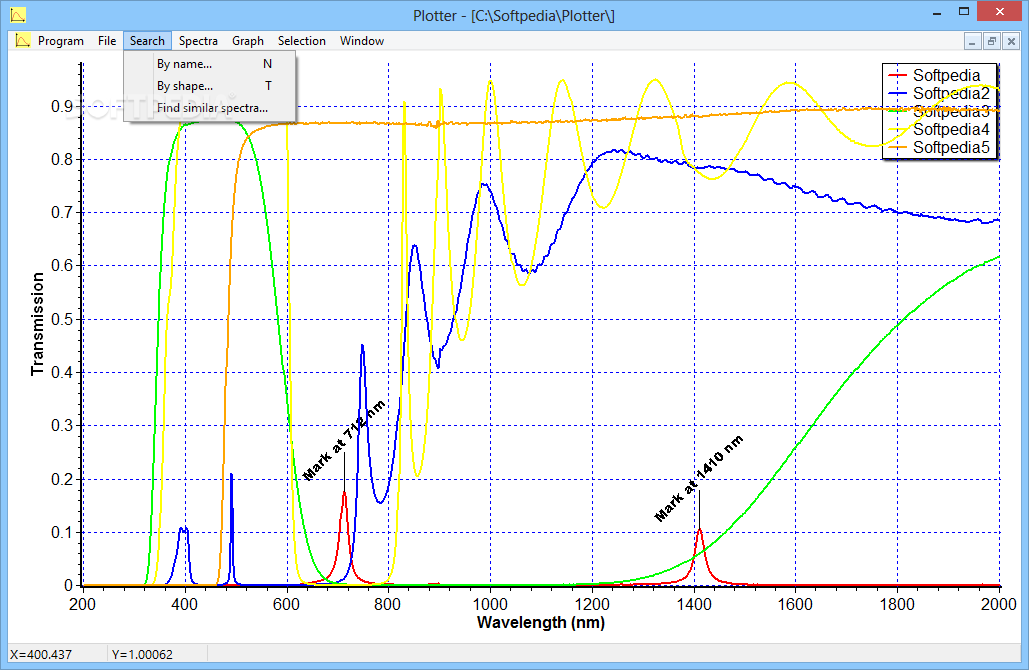
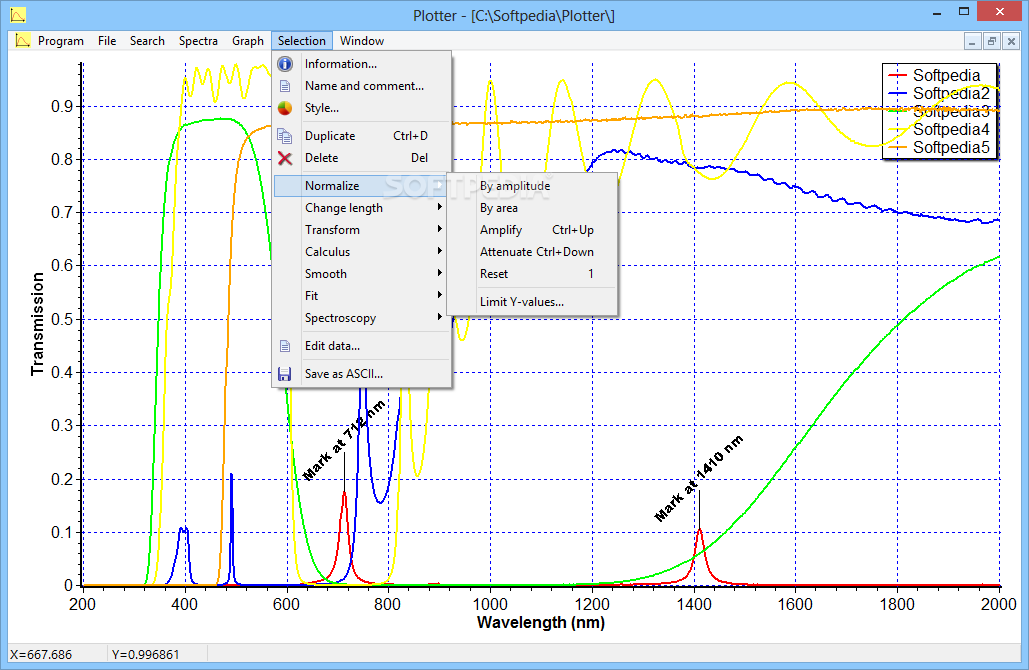
Plotter is not just limited to creating interactive graphs, it can perform basic functions with the data once it is inputted into the system. That being said, the biggest weakness of the software is its reliance on the ASCII format which several users will not be familiar with.
There are options to perform basic calculus functions on the data, but the wavelengths themselves can be changed via several other settings. The spectra can be normalized, have their length adjusted, different axis transformation options edited, the resolution can be adjusted to smooth out wavelength irregularities. The fit of the spectra on the graph and the zoom in scale can be adjusted, as well as different spectroscopy options that allow various conditions to be applied to the wavelengths.
A very helpful application once it is set up, yet a very difficult program to set up
All in all, Plotter is a useful tool for those who work with spectra and removes some of the labor intensive work required to convert them into workable formats. It offers a host of helpful options and settings, but the biggest problem by far is the lack of format capability, which holds the software back.


 Windows 7 and above
 View Screenshots(8)
 Comments
 Download


 Similar Software
 Recently Searched
 Software Categories
 Trending Software


 Like Us


