Works on: Windows 10 | Windows 8.1 | Windows 8 | Windows 7 | Windows XP | Windows 2000 | Windows 2003 | Windows 2008 | Windows 98 | Windows ME | Windows NT | Windows Vista | Windows 2012 SHA1 Hash: 6248380a314eb6af44bea2088cd91721d12a086b Size: 4.36 MB File Format: exe
Rating: 2.086956521
out of 5
based on 23 user ratings
Publisher Website: External Link Downloads: 353 License: Demo / Trial Version
Point & Figure Charts is a demo software by Numeral Technology and works on Windows 10, Windows 8.1, Windows 8, Windows 7, Windows XP, Windows 2000, Windows 2003, Windows 2008, Windows 98, Windows ME, Windows NT, Windows Vista, Windows 2012.
You can download Point & Figure Charts which is 4.36 MB in size and belongs to the software category Personal Finance. Point & Figure Charts was released on 2013-05-08 and last updated on our database on 2017-04-25 and is currently at version 2.
Thank you for downloading from SoftPaz! Your download should start any moment now. It would be great if you could rate and share:
Rate this software:
Share in your network:
Point & Figure Charts Description
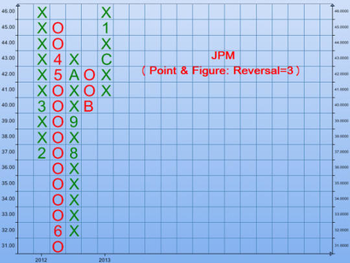
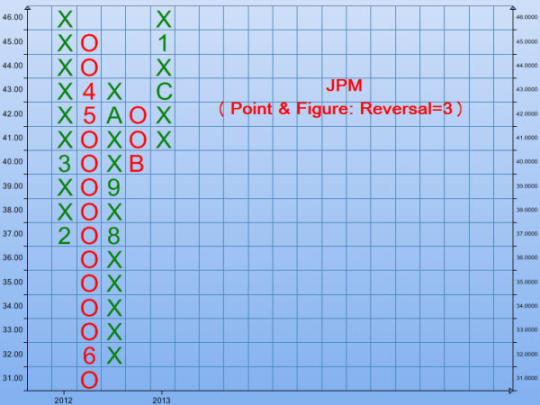
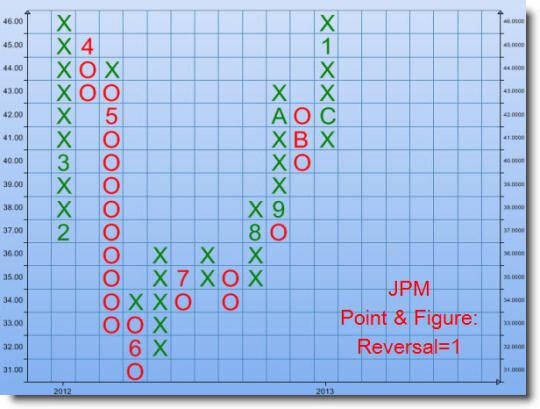
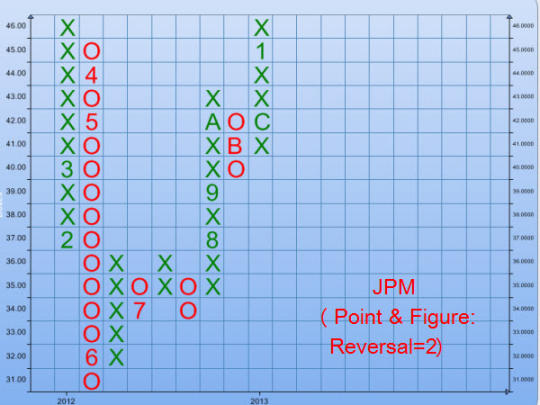
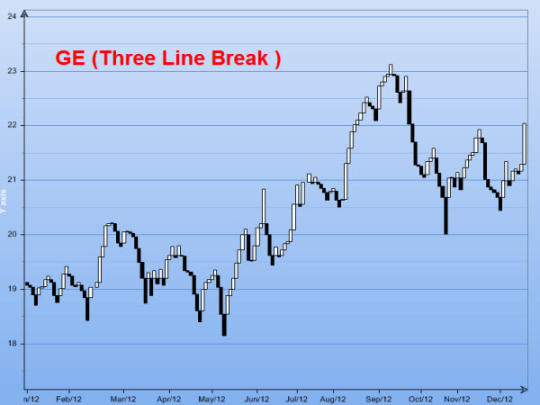
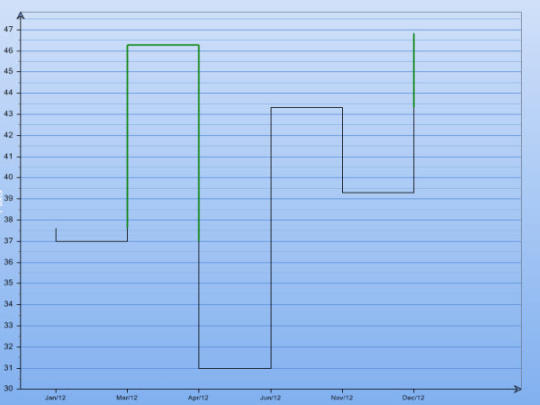
Point & Figure Charts software is an interactive stock analysis tool. It can create various technical indicator charts to help users identify buy-and-sell signals. It takes market stock data from Yahoo,Opentick and data in MetaStock format. It is packaged with a free downloader to download stock data from the Internet. The Premier Feature: Point & Figure Chart is implemented with classic scale ad custom scale. With one click users will get Point & Figure chart with various technical indicators. Key Features: Candlestick, Three Line Break (TLB), KAGI, MACD, stochastic oscillator and Bollinger Band & Envelope. Most frequently used, powerful moving averages: * SMA : Simple Moving Average * EMA : Exponential Moving Average * WMA : Weighted Moving Average * TMA : Triangular moving Average * HMA : Hull Moving Average (new !) * TEMA : Triple Exponential Moving average * LMA : Linear Moving Average * MMA : Modified Moving Average All these moving averages can be calculated on close, open, high, low prices and volume that users can specify in any period . These moving averages can be added on Candlestick chart to identify potential buy-and-sell signals. For the individuals who like Bollinger Band & Envelope, all these moving averages can be added on it too. In addition to the above features, it is also built with popular stochastic indicators. Users can specify %K period, %K slowing period, %D period. With this feature users can study stochastic indicators on any stock price and identify potential buy-and-sell indicators. Another built-in stock indicator is MACD (moving average convergence/divergence). Users can specify any valid, long period, short period, signal period. More details can be found on http://www.numeraltechnology.com
Whats new in this version:
Version 2.0.1 includes user interface enhancements, free stock data downloader ehancements, bug fixes.
Where to buy?
Last updated price and discount information 9 years agoupdate now


 Windows NT and above
 View Screenshots(5)
 Comments
 Download


 Similar Software


 Recently Searched
 Software Categories
 Trending Software


 Like Us


