Works on: Windows 10 | Windows 8.1 | Windows 8 | Windows 7 | Windows XP | Windows 2000 | Windows 2003 | Windows 2008 | Windows Vista | Windows 2012 SHA1 Hash: 9f437d2469fb92f98ef50fb6dbf2bf27b28b7660 Size: 18.8 MB File Format: zip
Rating: 1.782608695
out of 5
based on 23 user ratings
Downloads: 514 License: Free
PRTG Traffic Grapher is a free software by Paessler AG and works on Windows 10, Windows 8.1, Windows 8, Windows 7, Windows XP, Windows 2000, Windows 2003, Windows 2008, Windows Vista, Windows 2012.
You can download PRTG Traffic Grapher which is 18.8 MB in size and belongs to the software category Bandwidth Tools. PRTG Traffic Grapher was released on 2009-06-01 and last updated on our database on 2017-02-24 and is currently at version 6.2.
Thank you for downloading from SoftPaz! Your download should start any moment now. It would be great if you could rate and share:
Rate this software:
Share in your network:
PRTG Traffic Grapher Description
Reliable network monitoring used by more than 100.000 users every day
Supports data acquisition via SNMP, packet sniffing or Netflow protocol
Classifies network traffic by IP address, protocol and other parameters
Works with most switches, routers, firewalls, and other network devices
Easy installation with a few clicks on Windows 2000/XP/2003
Monitoring engine is capable of monitoring up to several thousand sensors
A Freeware Edition is available for smaller networks and SOHOs
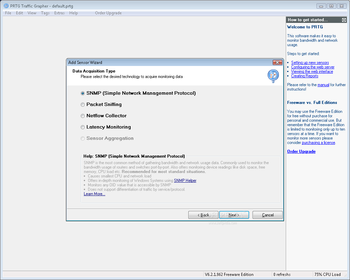
Supported Data Acquisition Methods
Depending on your infrastructure you can monitor the usage of your network using different methods supported by PRTG Traffic Grapher. You can choose between four common methods for (bandwidth) monitoring:
SNMP: Simple Network Management Protocol is the basic method of gathering bandwidth and network usage data. It can be used to monitor bandwidth usage of routers and switches port-by-port as well as device readings like memory, CPU load etc. Supports SNMP Version 1, 2c and 3.
Packet Sniffing: The Packet Sniffer inspects all network data packets passing the PC's network card(s) and is able to classify network traffic by IP address, protocol and other parameters
Netflow: The Netflow protocol is supported by most Cisco routers to measure bandwidth usage. Although being the most complex type to set up it is also the most powerful method suitable for high traffic networks and can also classify network traffic by IP address, protocol and other parameters.
Latency: Monitoring performance of a data line or a device by measuring PING times
Note: Only with packet sniffer and netflow based monitoring it is possible to measure the traffic by IP address, and/or protocol. SNMP based traffic measurement is port-based only.
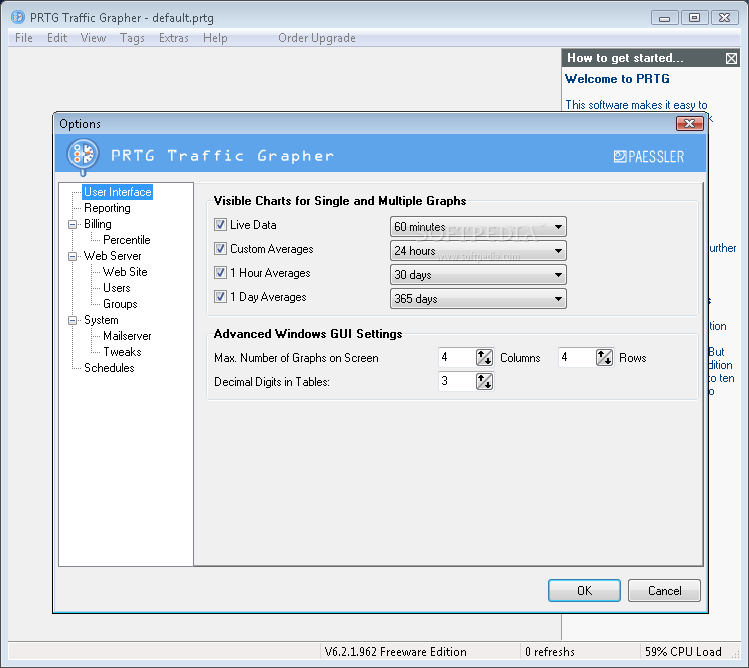
Windows and Web Based User Interface
Monitoring data can be accessed via a Windows GUI and a web based front end
Intuitive Windows user interface for data retrieval and configuration
Integrated web server for remote access (no external web server necessary)
Results are shown in various graphs and tables
Graphs are always generated on-the-fly for live reporting
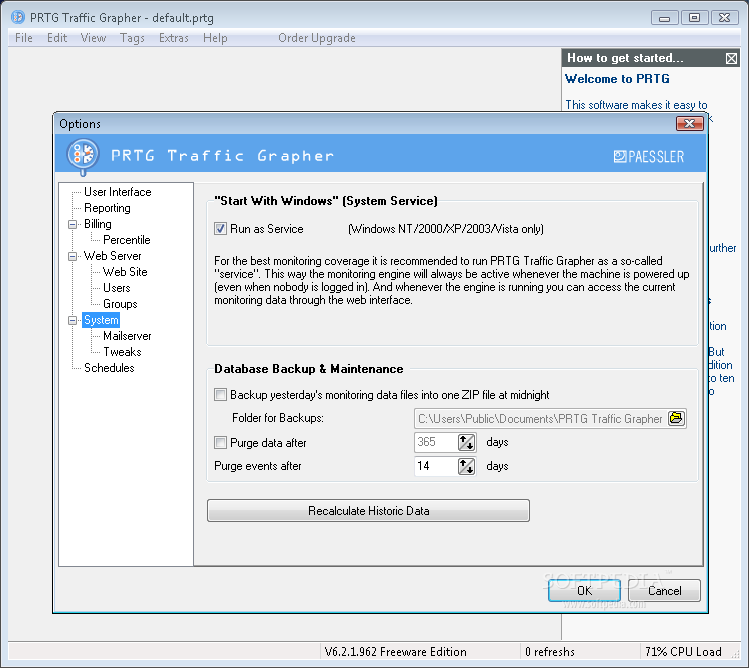
Monitoring Database
Internal database for fast and efficient storage of historic data
Optional export of monitoring results into CSV files for custom reporting
Database offers optional zipped backup and purging of old data
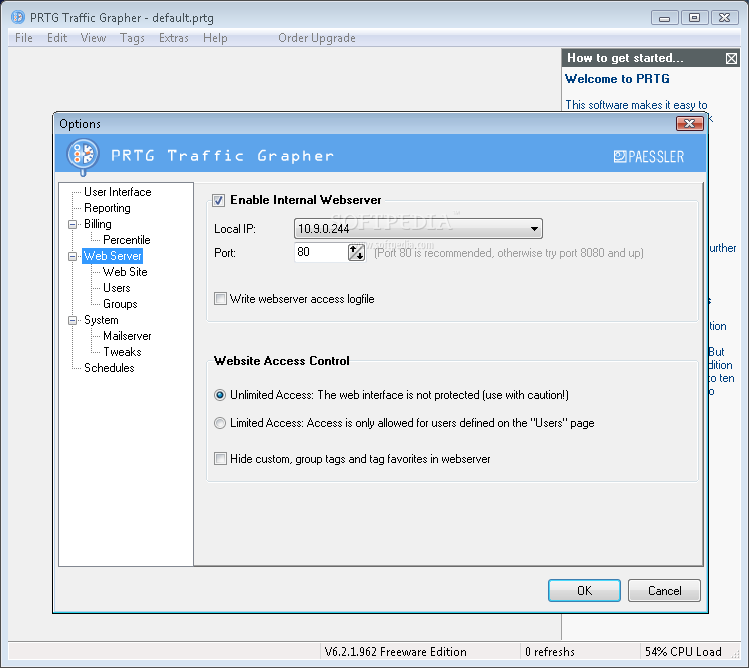
Internal Web Server
Easy to use navigation allows to drill into the live monitoring results
Fully "skinable" web interface using HTML templates (several default skins included)
Web server supports public (anyone can view the data) as well as authenticated access (username/password necessary) for multiple users
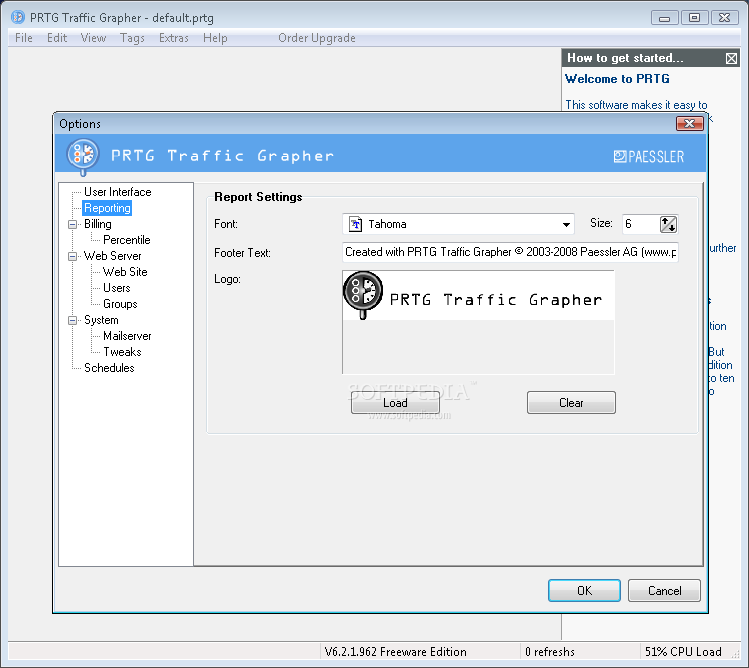
Reports
Configurable reports (graphs and data tables) in HTML, Excel, TIF, RTF, or PDF format
Daily, monthly, and yearly reports can be exported via email or saved to file
x% percentile calculation for any percentile value, any intervall, and any time frame
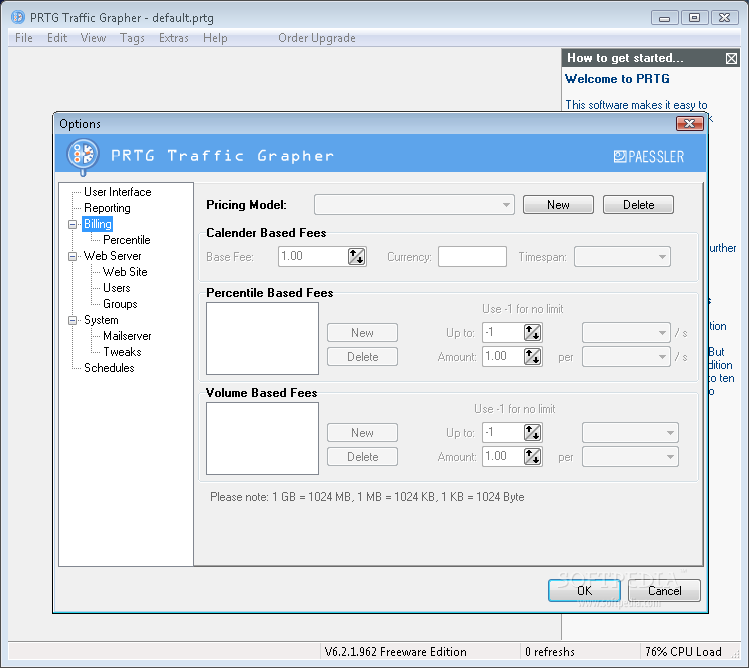
Includes a billing system for bandwidth based billing
SNMP Related Features
Monitors any value that is accessible by SNMP (i.e. any given OID Object ID)
Supports SNMP Versions 1 (base standard), 2C (64 bit counters) and 3 (authentication and encryption)
Support 32-bit and 64-bit counters
Brings its own extensive OID database with many preconfigured SNMP settings (e.g. for CPU loads, disk usages, printer page counts, environmental monitoring, and many more)
Supports Paessler SNMP Helper for easy access to several thousand performance counters on Windows based machines via SNMP
MIB files can be converted into OIDLIBs to monitor any device that supports SNMP
Various SNMP parameters (e.g. port, timeout) can be set by the user
Other System Features
Runs as an "nt service" on Windows 2000/XP/2003 to ensure that monitoring runs all the time (you do not have to be logged into your machine to keep monitoring running)
Extensive filtering can be applied for Netflow and Packet Sniffing based monitoring
Sensors can be "tagged" for easy navigation in long sensor lists
Easy setup of the same set of sensors for several devices usind Device Templates
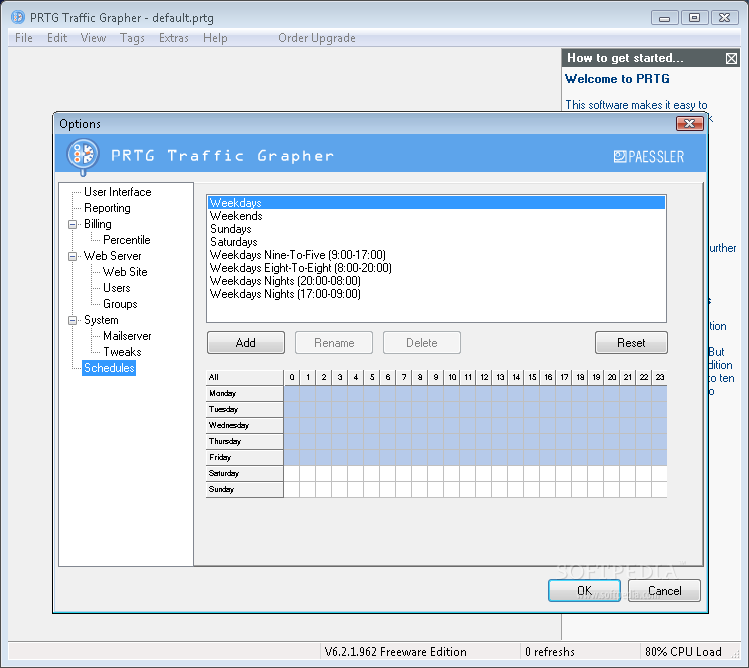
Monitoring and notifications can be paused using user defined schedules.


 Windows 2000 and above
 View Screenshots(7)
 Comments
 Download


 Similar Software


 Recently Searched
 Software Categories
 Trending Software
 Like Us


