Works on: Windows 10 | Windows 8.1 | Windows 8 | Windows 7 | Windows 2012 SHA1 Hash: 3f877eec2fbbc716a1fcebd2d98109716223b537 Size: 733.62 KB File Format: zip
Rating: 2
out of 5
based on 23 user ratings
Downloads: 1267 License: Free
RSPlot is a free software by Robin Schmidt and works on Windows 10, Windows 8.1, Windows 8, Windows 7, Windows 2012.
You can download RSPlot which is 733.62 KB in size and belongs to the software category Science CAD. RSPlot was released on 2010-03-14 and last updated on our database on 2017-02-26 and is currently at version 1.
Thank you for downloading from SoftPaz! Your download should start any moment now. It would be great if you could rate and share:
Rate this software:
Share in your network:
RSPlot Description
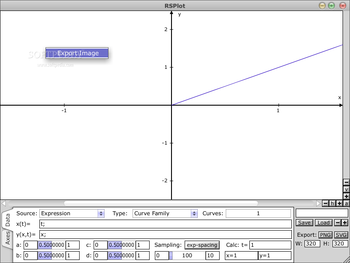
The RSPlot application was developed to be a mathematical curve and function plotting tool. It supports plotting of single curves or functions, parametrized curve/function families and plotting of several unrelated curves/functions in one single plot. The result can be exported to an .svg vector graphics ï¬le or to a .png bitmap graphics ï¬le.
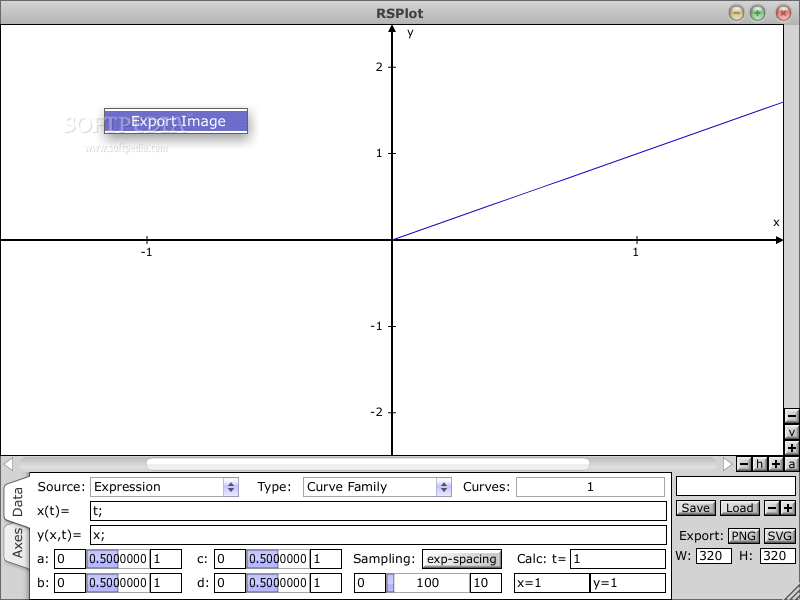
RSPlot allows for plotting several curves into one single plot. These curves may or may not be related with one another. For a (parameterized) curve or function family, you may use the character n inside the equations which is always assigned to the index of the respective curve which is currently drawn.
The minimum value for n is always 1 and the maximum value is given by the number of curves which should be drawn (as selected via the ’Curves’ slider). For example, the expressions x(t) = t; and y(x, t) = cheby(x, n − 1); will draw all Chebyshev polynomials from order 0 to N − 1 where N is the number of curves.
You may use subexpressions as decsribed above to paramterize the curves by different values than the curve index, for example, you could have been written: k = n − 1; cheby(x, k); in the y-expression ï¬eld without changing the result. And of course you can use more complex expressions to derive the curve-parameter k from the curve-index.


 Windows 7 and above
 View Screenshots(2)
 Comments
 Download


 Similar Software
 Recently Searched
 Software Categories
 Trending Software

 Like Us


