Works on: Windows 10 | Windows 8.1 | Windows 8 | Windows 7 | Windows XP | Windows 2000 | Windows 2003 | Windows 2008 | Windows Vista | Windows 2012 SHA1 Hash: d1552ab6345e7d184a9d6b31ebeec08d076d7d79 Size: 142.65 KB File Format: exe
Rating: 2.217391304
out of 5
based on 23 user ratings
Publisher Website: External Link Downloads: 698 License: Free
Spectrum Analyzer is a free software by Max Mikhailov and works on Windows 10, Windows 8.1, Windows 8, Windows 7, Windows XP, Windows 2000, Windows 2003, Windows 2008, Windows Vista, Windows 2012.
You can download Spectrum Analyzer which is 142.65 KB in size and belongs to the software category Audio. Spectrum Analyzer was released on 2015-06-21 and last updated on our database on 2017-04-06 and is currently at version 1.04.
Thank you for downloading from SoftPaz! Your download should start any moment now. It would be great if you could rate and share:
Rate this software:
Share in your network:
Spectrum Analyzer Description
The utility is compatible with VST hosts and its functionality resembles early spectrum analyzers since it is not FFT-based; instead it compensates by featuring powerful filter sets.
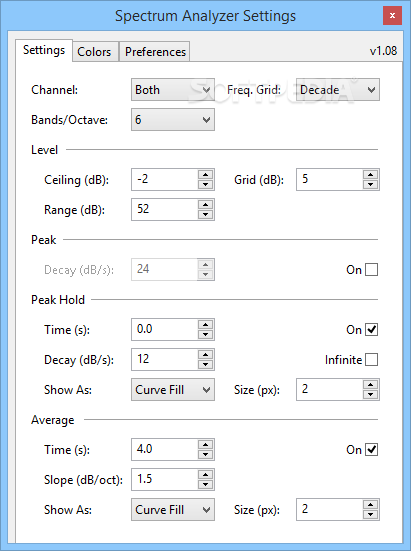
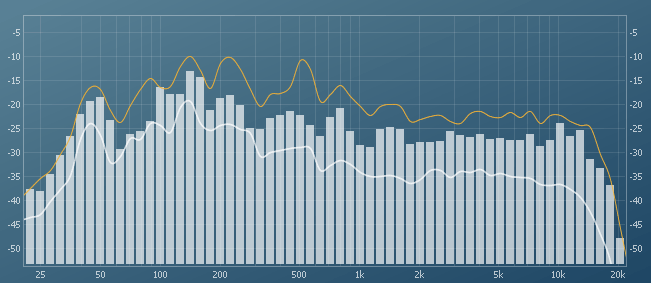
The plugin can analyze several octave modes, including ⅓, ¼ and ⅙, in other words 30, 40 or 60 bands. Different graphs indicate the peak for each frequency line, as well as the peak-hold value and the average (RMS) in the same display.
Additionally, you can change the frequency grid, choosing between decade or octave, as well as modify the decibel levels. The values refer to the ceiling level, the range and the grid markers.
You may enable the peak decay, measured in decibels per second and set the peak hold duration.
The peak hold can be represented as any of the supported graph displays and you may also set its size, in pixels.
The average parameters include the duration (in seconds), slope (decibels per octave), size and graph display mode.
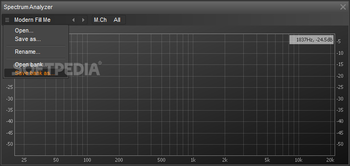
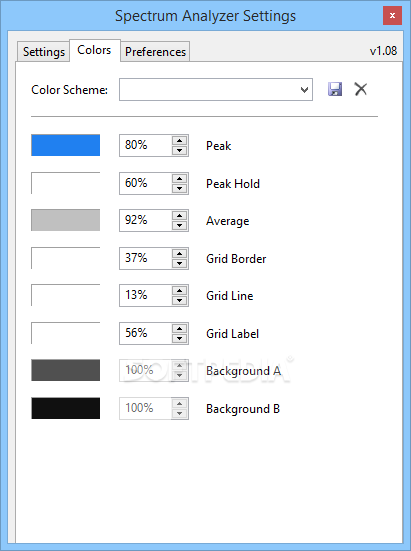
You can easily switch the view from bar charts to curved indicators and curve fill charts. Moreover, you can change the colors of the display by right-clicking on the graph and selecting the designated tab.
If you have a previously saved color scheme, you can load it, otherwise, you can choose the nuances for the peaks, peak hold, average, grid border, grid line, label and background gradient. Moreover, each modification you make in the color scheme can be saved in a new configuration file.
Spectrum Analyzer also features a series of grid indicators templates, in which the variations indicate the frequency and the decibel level.
For example, the Default mode can measure the spectrum starting with -48 dB and 24 Hz, while Modern Fill Me graph can start as low as -54 dB.System requirements900 MHz CPU with SSE2 instruction set
VST host application


 Windows XP and above
 View Screenshots(4)
 Comments
 Download


 Recently Searched
 Software Categories
 Trending Software


 Like Us


 Similar Software


