Works on: Windows 10 | Windows 8.1 | Windows 8 | Windows 7 | Windows 2012 SHA1 Hash: 754ea8bf116a3c5641b2f8adca4651585dcfe627 Size: 610 bytes File Format: jnlp
Rating: 2.52173913
out of 5
based on 23 user ratings
Downloads: 418 License: Free
StatTools is a free software by Michigan State University and works on Windows 10, Windows 8.1, Windows 8, Windows 7, Windows 2012.
You can download StatTools which is 610 bytes in size and belongs to the software category Home and Education. StatTools was released on 2014-03-26 and last updated on our database on 2017-03-30 and is currently at version 1.
Thank you for downloading from SoftPaz! Your download should start any moment now. It would be great if you could rate and share:
Rate this software:
Share in your network:
StatTools Description
Working with statistics can prove challenging, as sometimes the large quantity of information and numbers can be overwhelming. Using a computer application in order to determine various results and diagrams can help you create diagrams and statistical data distributions faster.
StatTools is a handy application that can help you store all sort of statistical data, then build distribution diagrams according to it, which will allow you to observe the evolution of your experiments.
In order to work properly, the application requires Java installed on your computer, as well as Internet connection.
Intuitive statistical information database
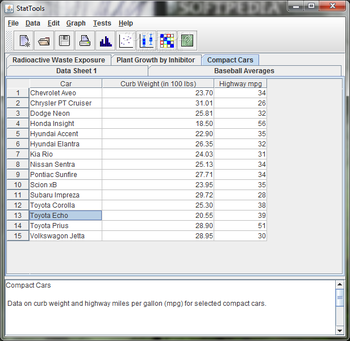
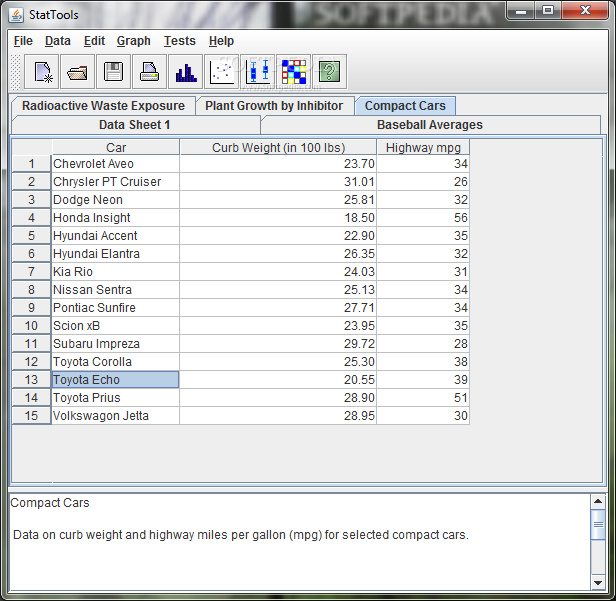
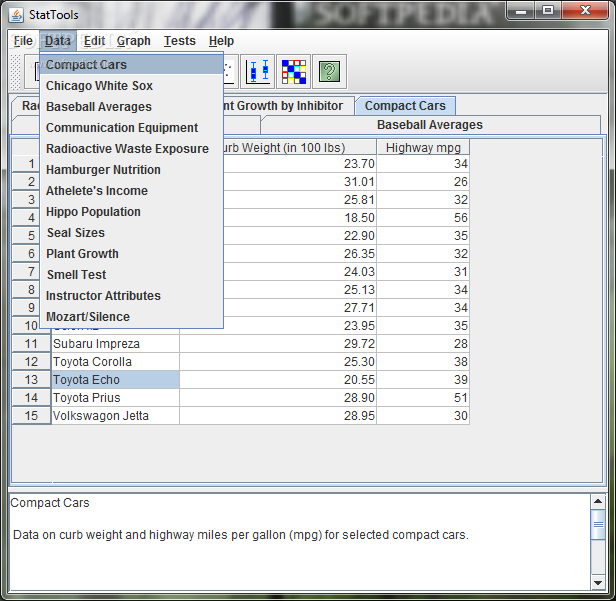
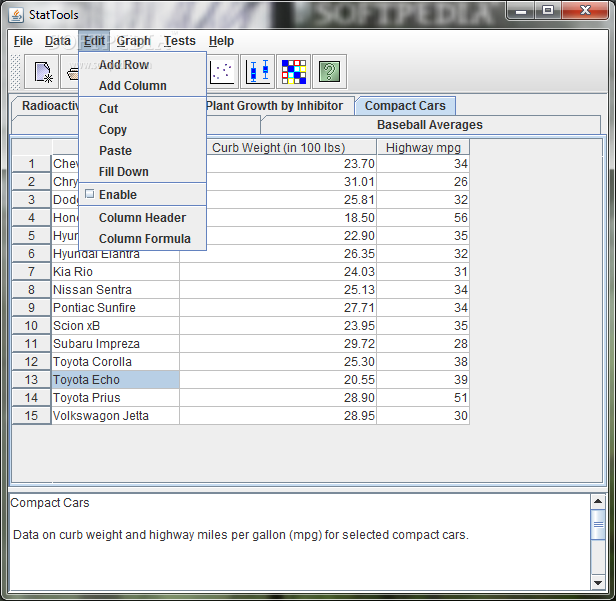
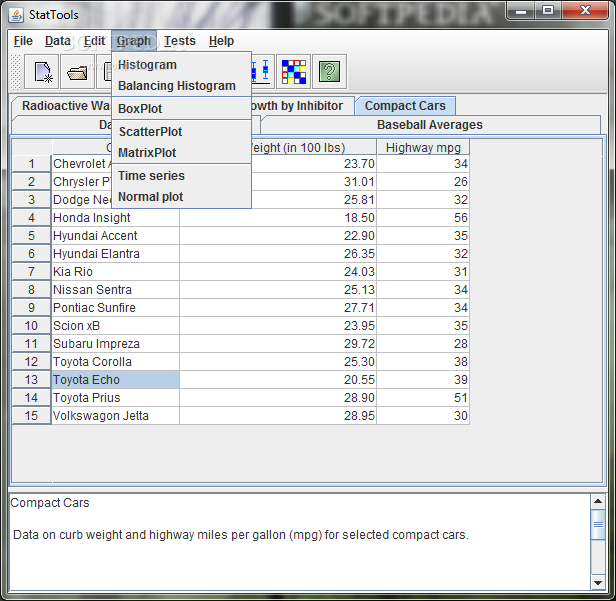
The program can help you save various data, on which you can perform statistical analysis. Using an Excel-like table format, you can add information in every row and column created.
Furthermore, the application has a text area that can be used to describe the details of various collected data. For instance, you can explain how the data was collected and how many samples have been used during a certain experiment.
Powerful graph builder
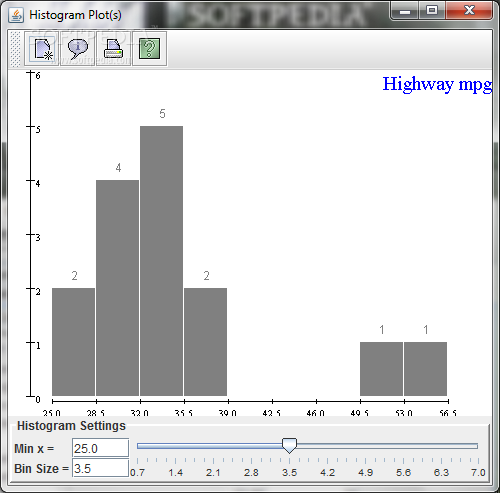
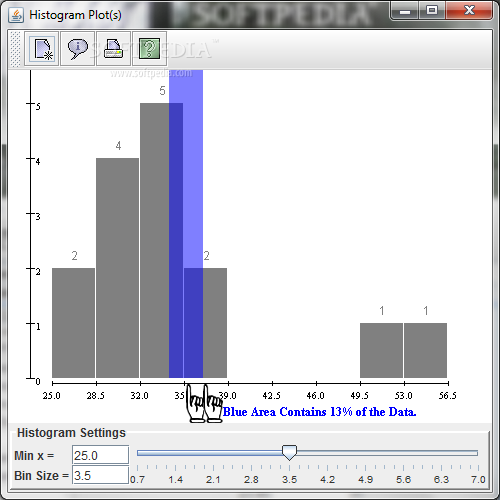
StatTools can build several diagrams, graphs and plots, using the data stored. You can easily create a histogram using the information stored in the database. In addition, you can find out how much data is distributed on several statistical values.
You can easily find out the spread or distribution of certain samples by creating a comparative scatter plot. This feature can help you determine the evolution of certain batches of samples, whether they tend to normalize or randomize.
An overall good statistical dataset repository
StatTools allows you to analyze any statistical data, offering you the possibility to create several diagrams and graphs using the information stored in the datasets. Using the application, you can observe the statistical ups and downs of your collected information.


 Windows 7 and above
 View Screenshots(6)
 Comments
 Download


 Similar Software
 Recently Searched
 Software Categories
 Trending Software
 Like Us


