Works on: Windows 10 | Windows 8.1 | Windows 8 | Windows 7 | Windows XP | Windows 2000 | Windows 2003 | Windows 2008 | Windows Vista | Windows 2012 SHA1 Hash: 9755cffc7052c3e5f747c9e57ebbb2ce2e7c3aab Size: 14.02 MB File Format: exe
Rating: 2.52173913
out of 5
based on 23 user ratings
Downloads: 1478 License: Demo / Trial Version
StockChartX is a demo software by Primasoft Pc and works on Windows 10, Windows 8.1, Windows 8, Windows 7, Windows XP, Windows 2000, Windows 2003, Windows 2008, Windows Vista, Windows 2012.
You can download StockChartX which is 14.02 MB in size and belongs to the software category Accounting and Billing Software. StockChartX was released on 2006-05-17 and last updated on our database on 2017-06-14 and is currently at version 5.8.
Thank you for downloading from SoftPaz! Your download should start any moment now. It would be great if you could rate and share:
Rate this software:
Share in your network:
StockChartX Description
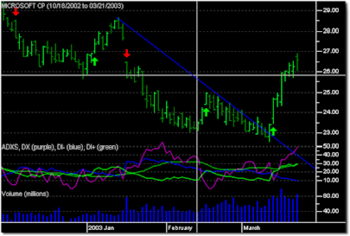
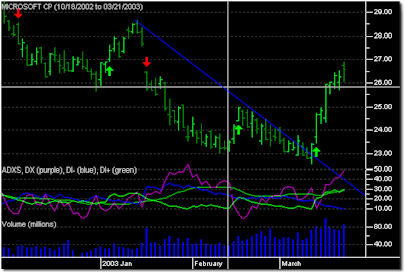
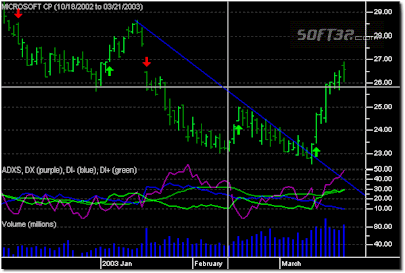
For .NET, VB6, C++ and other languages: StockChartX features new charting types: 3D Candlesticks, Renko, Kagi, Three Line Break, Point & Figure, Candlevolume, Equivolume, Shaded Equivolume, Darvas Boxes,Technical Analysis and more! Now developers can leverage their knowledge and existing code to easily integrate our lightweight COM-based ActiveX stock chart control. Developing with StockChartX using VB, VB.Net, C#, Excel, VC++, and Delphi, is quick and easy. StockChartX supports both Desktop applications and web charting applications. No other charting component comes close to the flexibility and completeness of StockChartX V.5 Pro. Modulus Financial Engineering does one thing and does it right... we do financial software engineering only! What this means is that you will find features built right into StockChartX that you will not find in any other charting component, guaranteed. Features that are specific to financial applications. Finally, a charting component designed BY traders, FOR traders! With StockChartX, you can chart real-time stock data, embed objects like buy, sell, exit or custom bitmap symbols, insert text, trend lines, custom drawings, multiple indicators, overlay indicators (share scales), display charts with semi-log or linear scaling, print charts, save charts as images, save/load charts as binary files, and much more! Use StockChartX as your essential front-end data analysis tool for developing interactive financial applications. StockChartX is the perfect addition to your financial engineering toolbox. StockChartX V.5 comes with very comprehensive VB6, VC++, VB.net, C#, Delphi 7, Borland C++ Builder, and Excel example projects, each containing 1,000 to 2,000 lines of highly commented source code.
Usage of this website means you agree to us storing non-personally identifiable cookies on your device. To know more how we use cookies, see our privacy policy.
Dismiss


 Windows XP and above
 View Screenshots(3)
 Comments
 Download


 Similar Software
 Software Categories
 Trending Software


 Like Us


 Recently Searched


