Version: 1 Last Updated: 22 Apr 2017 Release: 14 Feb 2011 Category: System
Rate this software:
434 downloads
View Screenshots(1)
Comments
Download
Liked it? Tell others:
Virto JQuery Charts for SharePoint Details
Works on: Windows 10 | Windows 8.1 | Windows 8 | Windows 7 | Windows 2003 | Windows 2008 | Windows Vista | Windows 2012 SHA1 Hash: c66ef755fc8866d33e849cb6a44e6afce2d097ff Size: 1.05 MB File Format: zip
Rating: 2.5
out of 5
based on 23 user ratings
Publisher Website: External Link Downloads: 434 License: Demo / Trial Version
Virto JQuery Charts for SharePoint is a demo software by Virtosoftware and works on Windows 10, Windows 8.1, Windows 8, Windows 7, Windows 2003, Windows 2008, Windows Vista, Windows 2012.
You can download Virto JQuery Charts for SharePoint which is 1.05 MB in size and belongs to the software category System. Virto JQuery Charts for SharePoint was released on 2011-02-14 and last updated on our database on 2017-04-22 and is currently at version 1.
Thank you for downloading from SoftPaz! Your download should start any moment now. It would be great if you could rate and share:
Rate this software:
Share in your network:
Virto JQuery Charts for SharePoint Description
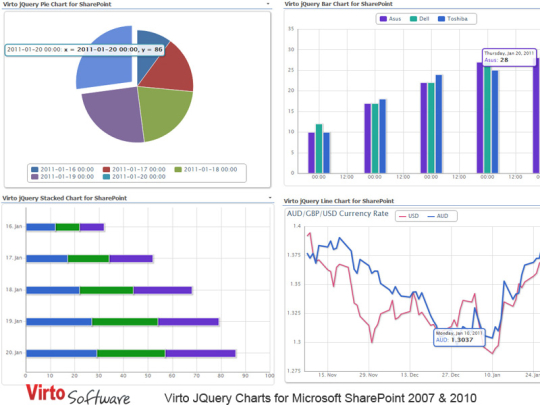
Virto Charts is a jQuery-based control for creating plots, graphs and charts in Microsoft SharePoint. Virto component produces beautiful line, bar and pie charts with many features. Charts can be based on a variety of data sources, including SharePoint Lists, SQL tables, XML etc.Key Features 1. SharePoint list, SQL database, XML file data sources 2. Ability to define chart height and width or diameter in pixels 3. RGB color coding for line and bar charts 4. Using chart zoom 5. Using stacked chart option 6. Highlighting data points 7. Ability to define colors for grid RGB color coding of X and Y axes 8. Axis auto scaling (automatic definition of minimum and maximum) 9. Showing/hiding chart title and placing it in different positions 10. Showing/hiding chart legend and placing it in different positions 11. Ability to hide data source on chart 12. Filtering options for displayed data 13. Value grouping and data aggregation for Y axis 14. Ability to define data format for X axis of date and time type Editions for SharePoint 2007 and 2010 versions
Where to buy?
Last updated price and discount information 9 years agoupdate now



 Windows 2003 and above
 View Screenshots(1)
 Comments
 Download





 Similar Software


 Recently Searched
 Software Categories
 Trending Software


 Like Us
