Works on: Windows 10 | Windows 8.1 | Windows 8 | Windows 2012 SHA1 Hash: 7fa571386179daf45116d7be0a2117c1b79f82af Size: 2.06 MB File Format: zip
Rating: 1.782608695
out of 5
based on 23 user ratings
Publisher Website: External Link Downloads: 1182 License: Demo / Trial Version
Virto SharePoint Gantt View is a demo software by Virtosoftware and works on Windows 10, Windows 8.1, Windows 8, Windows 2012.
You can download Virto SharePoint Gantt View which is 2.06 MB in size and belongs to the software category SDK DDK. Virto SharePoint Gantt View was released on 2011-01-04 and last updated on our database on 2017-04-22 and is currently at version 1.
Thank you for downloading from SoftPaz! Your download should start any moment now. It would be great if you could rate and share:
Rate this software:
Share in your network:
Virto SharePoint Gantt View Description
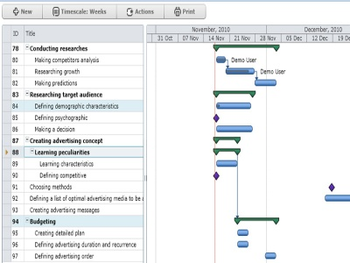
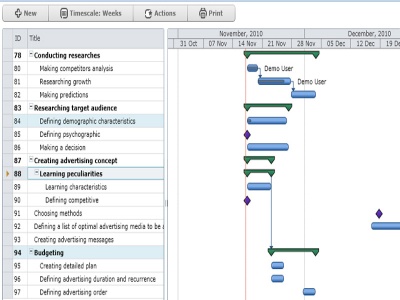
Virto Silverlight Gantt Chart View for Microsoft SharePoint 2007 or 2010 is intended for advanced visualization of SharePoint tasks. With this component SharePoint users get a simple and effective tool for displaying their tasks in Gantt Chart - a popular type of bar chart that illustrates a project schedule. New Virto Gantt Chart View is a nice and easy way to include Gantt Charts into your resource planning SharePoint applications without having to install full blown project management application such as Microsoft Project.Virto Gantt Chart View displays data of the type task from SharePoint lists in a way that conveniently presents all the relevant information about tasks in a single view as well as provides easy tools for quick task management. With the component a SharePoint user can have all his tasks and subtasks in a single view, easily create and complete tasks, assign resources, edit timeframes and percentage of completion with just several clicks. All these actions can be done in very convenient and interactive way as the web part is a Silverlight-based component.Virto Gantt Chart allows for several distinct views: standard table as well as day, week, month, quarter, 6-months and year Gantt Charts. When working with a table view you can easily resize and switch columns for conveniently displaying information and edit all the data inline, i.e. without opening the task edit form. Finally, the web part is a flexibly customizable solution. You can customize each element of a diagram choosing its size, color (and more) to make the component ideally fit your SharePoint environment.
Where to buy?
Last updated price and discount information 7 years agoupdate now


 Windows 2012 and above
 View Screenshots(1)
 Comments
 Download


 Similar Software
 Recently Searched
 Software Categories
 Trending Software

 Like Us


