Works on: Windows 10 | Windows 8.1 | Windows 8 | Windows 7 | Windows XP | Windows 2000 | Windows 2003 | Windows 2008 | Windows Vista | Windows 2012 SHA1 Hash: cdeb28d4450351ee7771f3ba09e375e4822baaab Size: 19.67 MB File Format: exe
Rating: 1.956521739
out of 5
based on 23 user ratings
Publisher Website: External Link Downloads: 1598 License: Demo / Trial Version
WinRock is a demo software by R.A.Kanen and works on Windows 10, Windows 8.1, Windows 8, Windows 7, Windows XP, Windows 2000, Windows 2003, Windows 2008, Windows Vista, Windows 2012.
You can download WinRock which is 19.67 MB in size and belongs to the software category Science CAD. WinRock was released on 2014-02-12 and last updated on our database on 2017-03-12 and is currently at version 8.6.
Thank you for downloading from SoftPaz! Your download should start any moment now. It would be great if you could rate and share:
Rate this software:
Share in your network:
WinRock Description
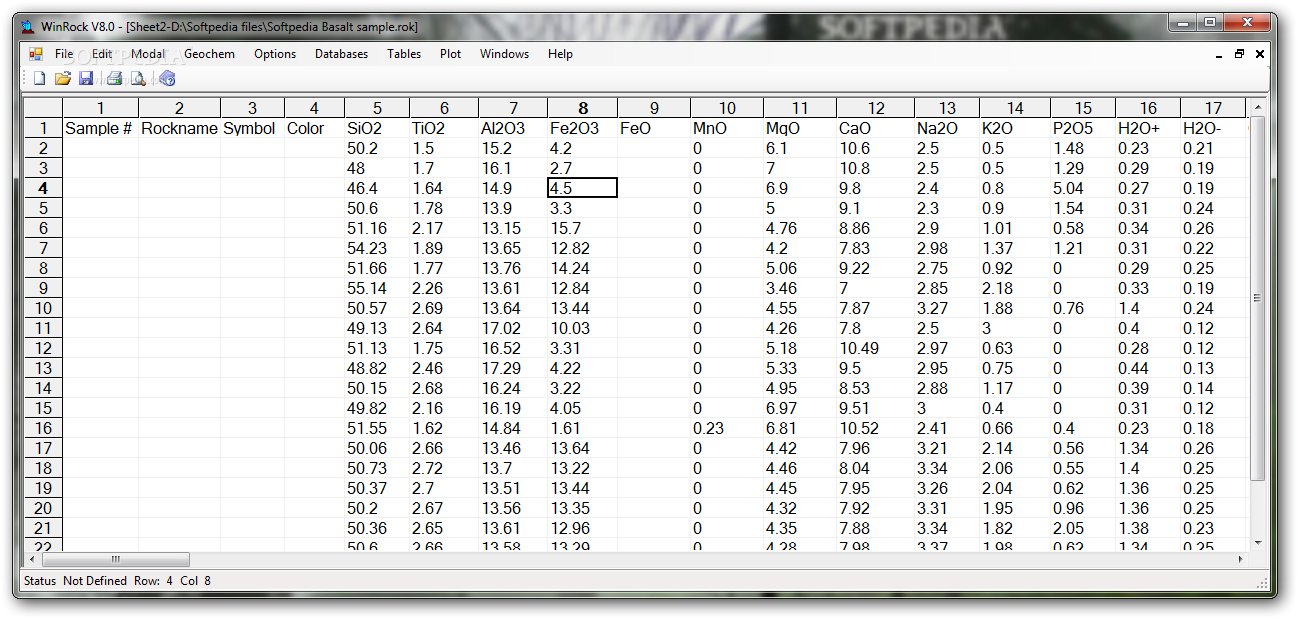
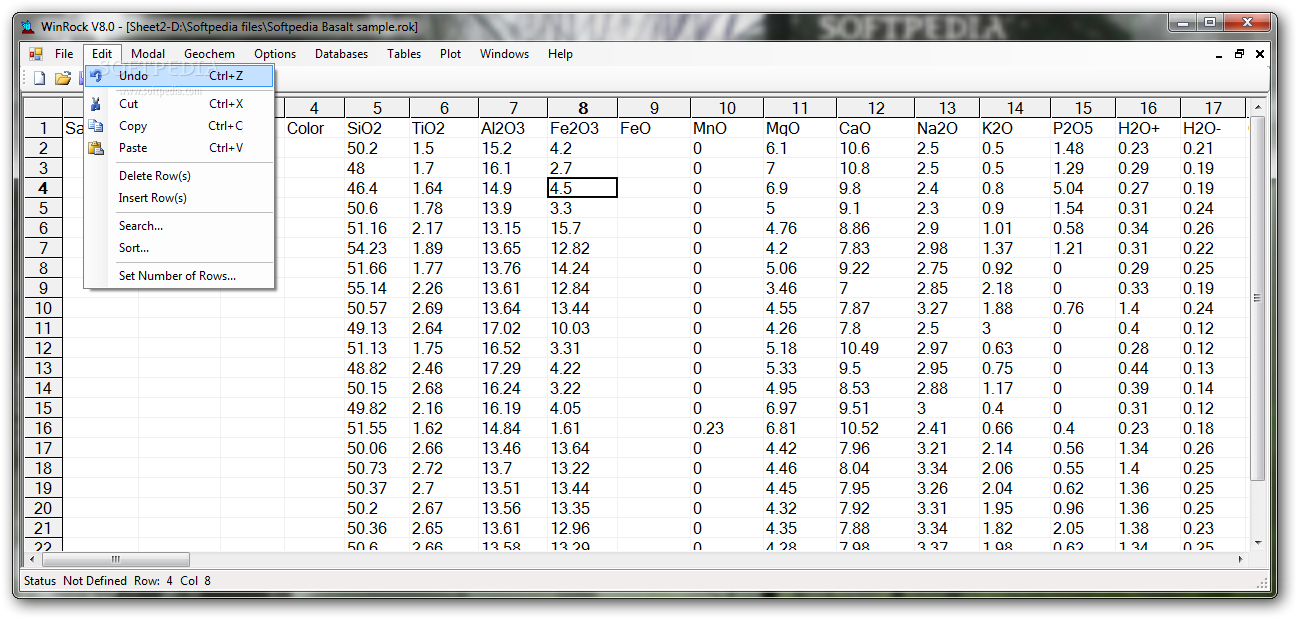
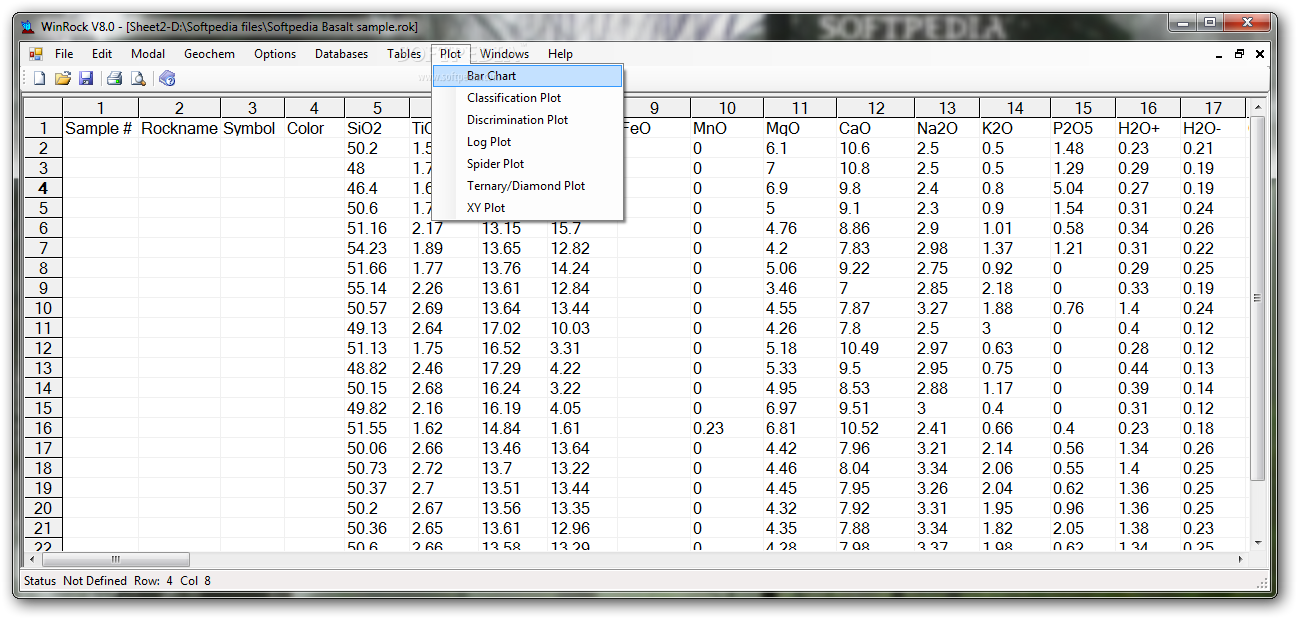
Built in Spreadsheet:
WinRock has an inbuilt spreadsheet for entering and editing data. The spreadsheet reads and writes tab delimited ASCII files, compatible with most spreadsheets and text editors.
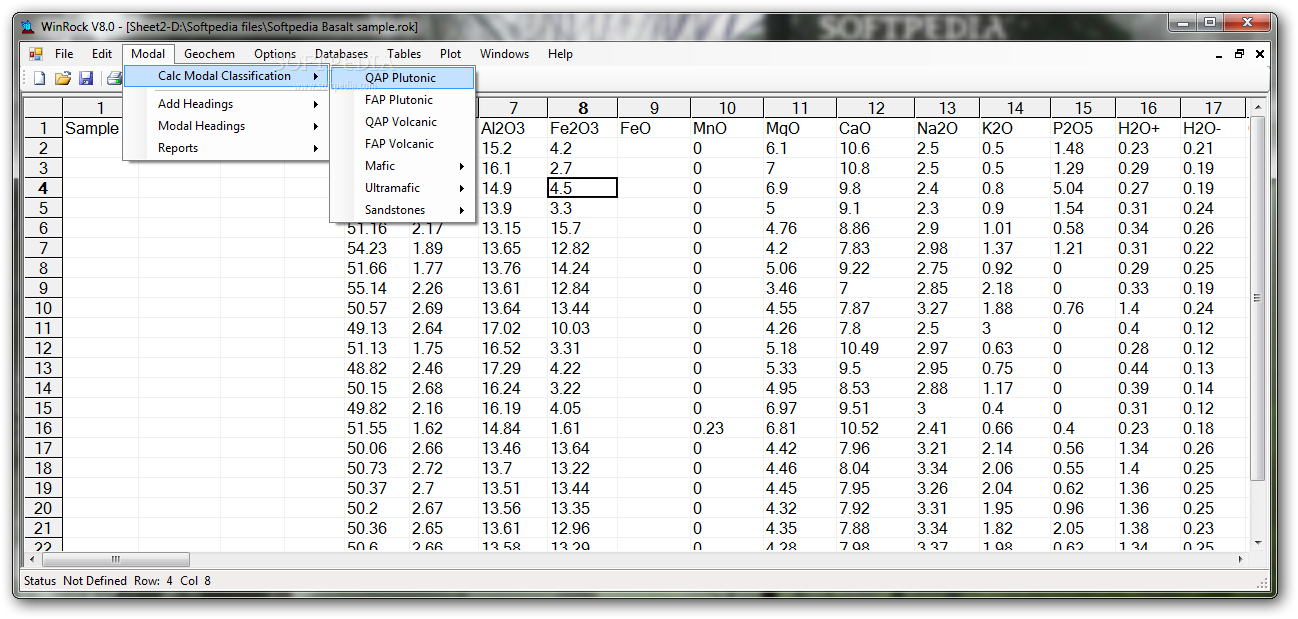
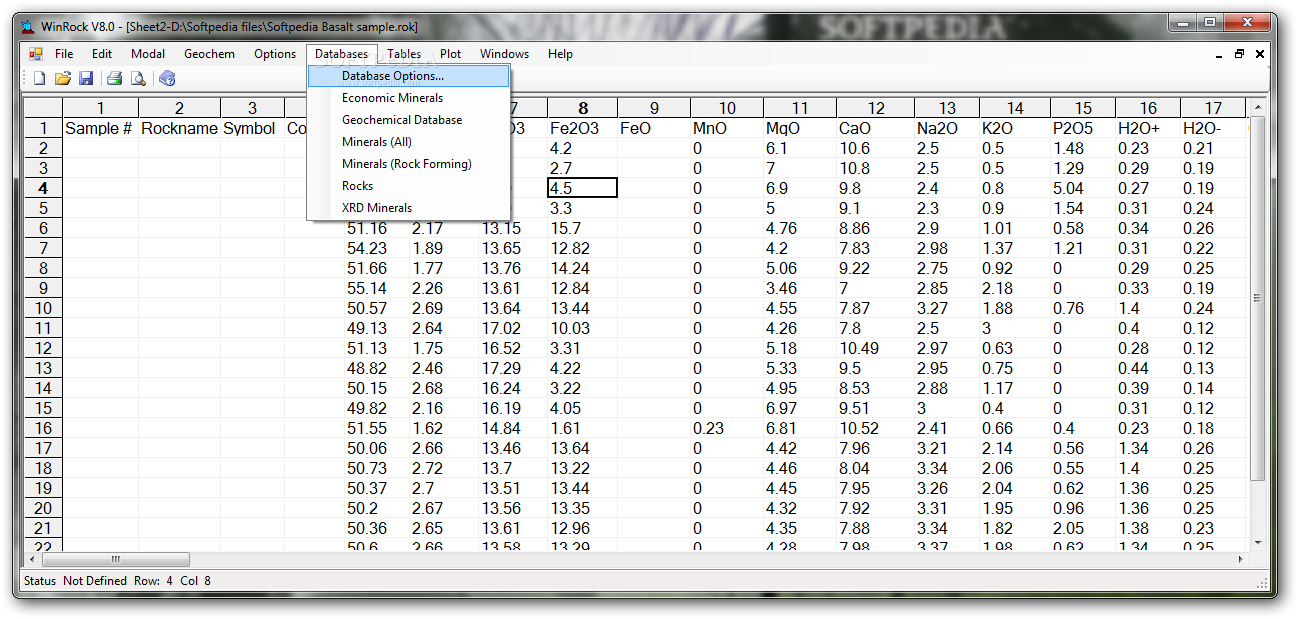
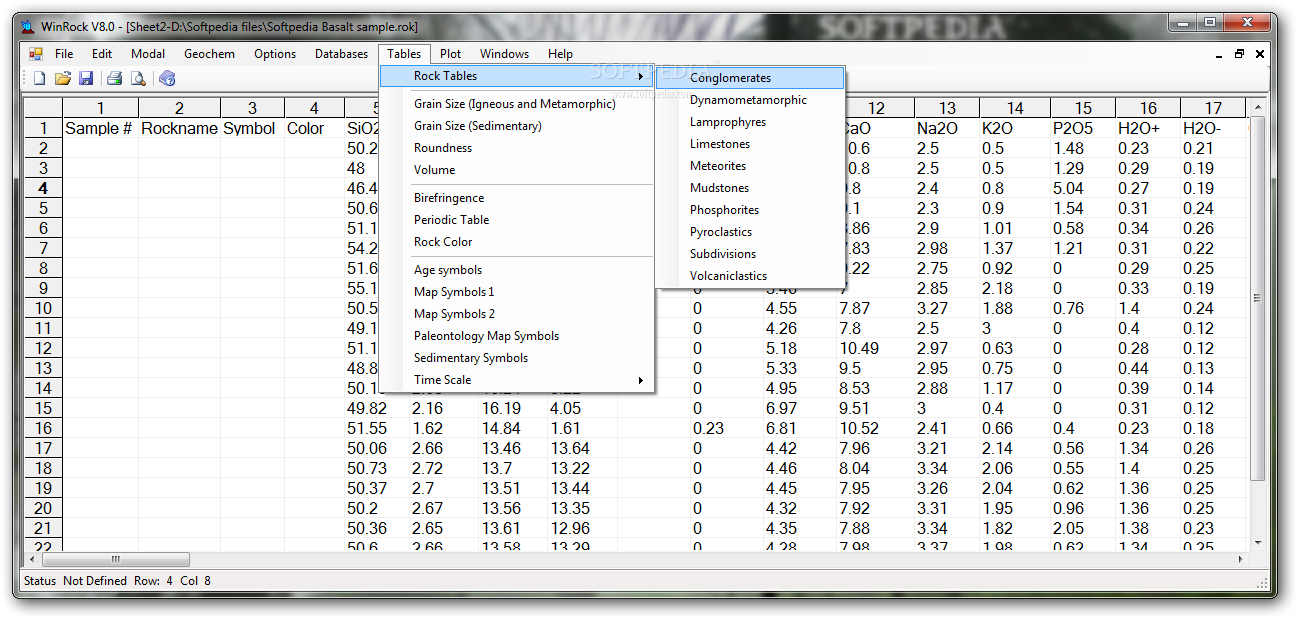
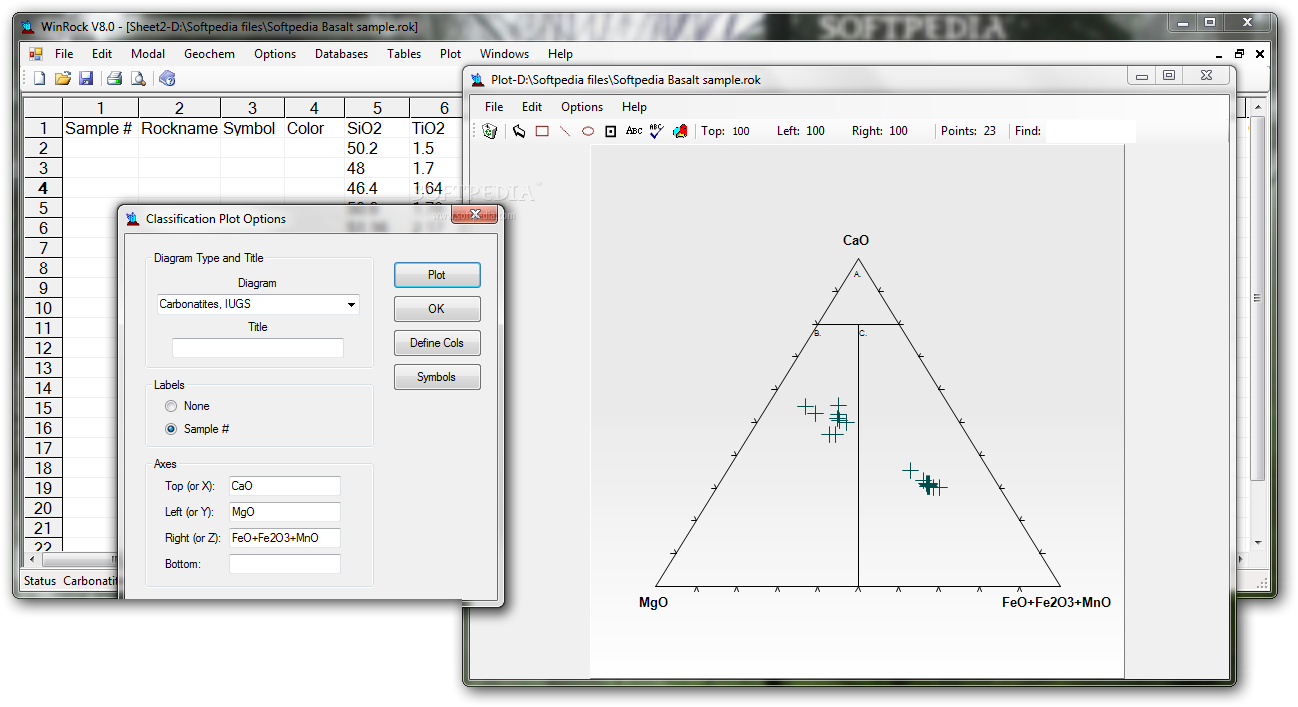
Standard Classification Diagrams:
Igneous and sedimentary rock classification diagrams are included: carbonatite, charnockite, melilite - plutonic, melilite - volcanic, QAPF general plutonic, QAP and FAP general plutonic, QAPF general volcanic, QAP and FAP general volcanic, PlagPxOl, PlagPxHbl, PlagOpxCPx, OlOPxCPx, OlPxHbl, general sandstone, Arenites and Wackes.
Petrology diagrams, including harker, ternary and spider plot diagrams are included
A number of geochemical classification diagrams, including, TAS plutonic and volcanic, Jensen Cation and tectonic classification plots are available.
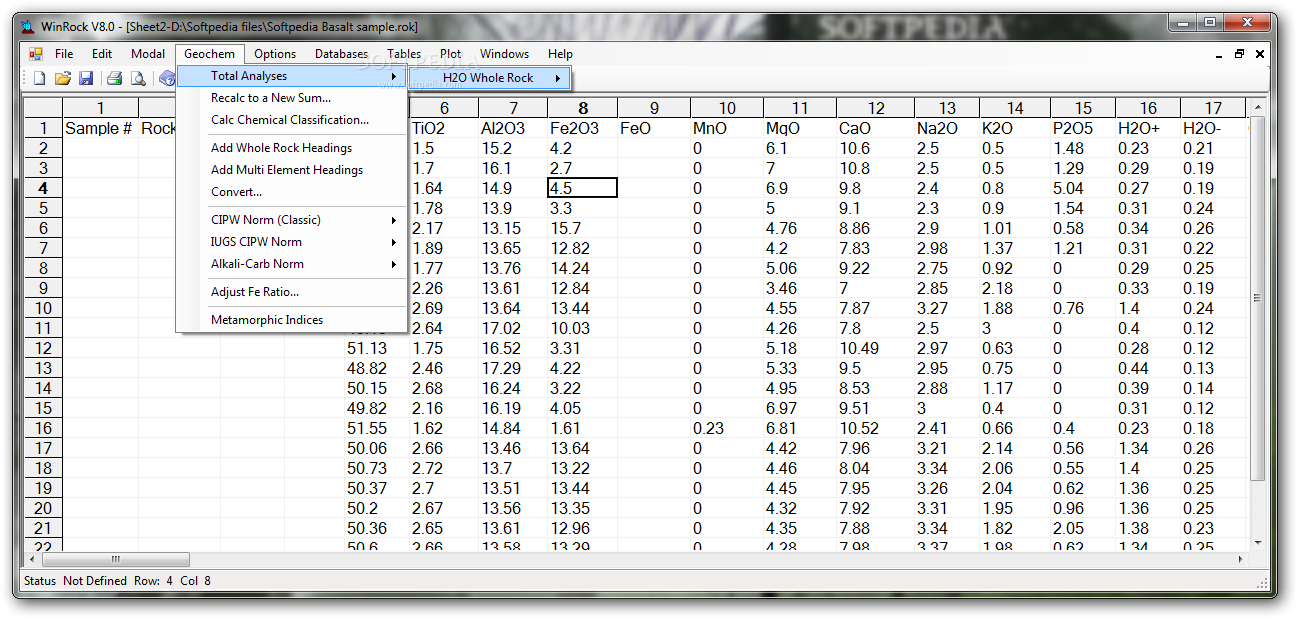
CIPW Norms:
Standard CIPW Norms for normal rocks can be calculated. Alkali norm for alkali and carbonatite rocks can be calculated
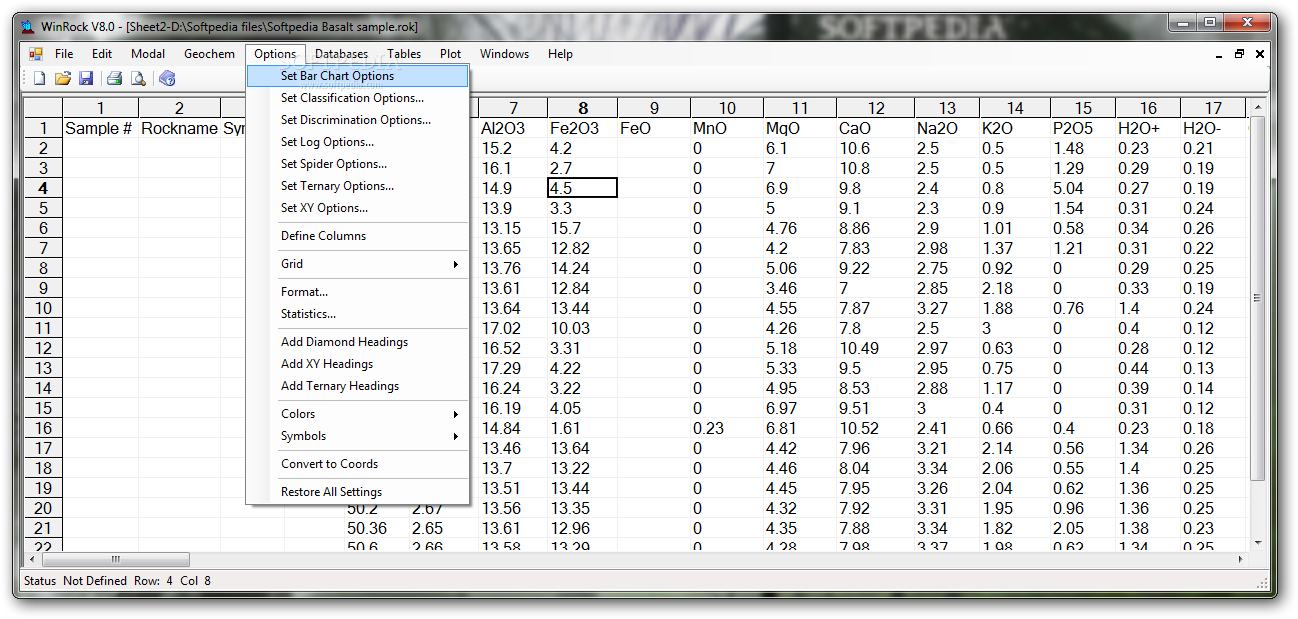
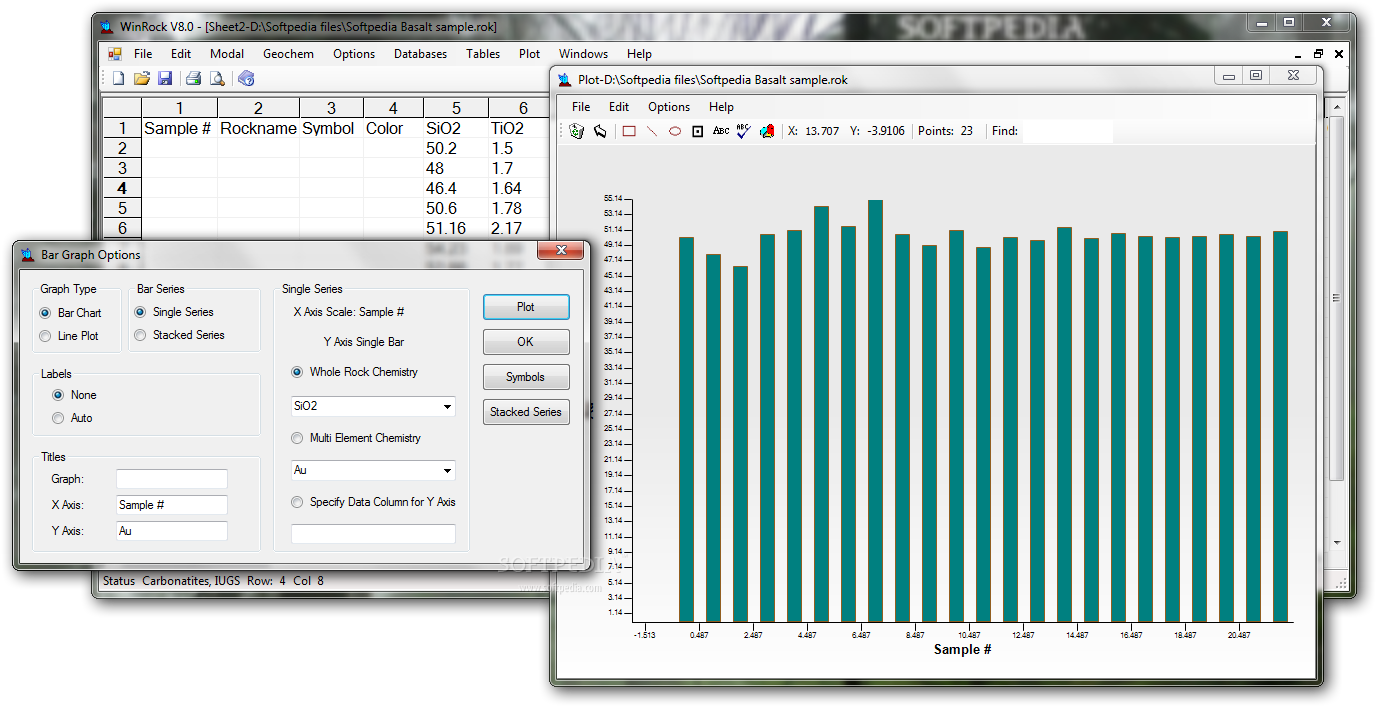
Graph Manipulation:
Many options are available for plotting data. WinRock will plot general purpose ternary, xy, log-log, log-linear and diamond graphs. A choice of symbols, labels and graph title are available to customise the graph. Labels can be placed on any number of data points. Choose colors and symbols. On screen control relates each highlighted data point to a set of data listed in a table. Copy graphs to the clipboard or save as bitmap files.
Printing:
Publication quality graphs can be obtained with a laser printer. Graphs can be customised with a choice of labels and symbols. Select from small, medium or large graphs. Print symbol and rockname legends with the graph.
Where to buy?
Last updated price and discount information 9 years agoupdate now


 Windows 2000 and above
 View Screenshots(10)
 Comments
 Download


 Similar Software
 Recently Searched
 Software Categories
 Trending Software


 Like Us


