Works on: Windows 10 | Windows 8.1 | Windows 8 | Windows 7 | Windows 2008 | Windows Vista | Windows 2012 SHA1 Hash: 75a9e3832095bd9ec76107d02d5260df3c4222e4 Size: 950.96 KB File Format: exe
Rating: 2.130434782
out of 5
based on 23 user ratings
Publisher Website: External Link Downloads: 1351 License: Demo / Trial Version
5dchart Add-in for Excel is a demo software by System Approach, Ltd and works on Windows 10, Windows 8.1, Windows 8, Windows 7, Windows 2008, Windows Vista, Windows 2012.
You can download 5dchart Add-in for Excel which is 950.96 KB in size and belongs to the software category Other Office Tools. 5dchart Add-in for Excel was released on 2016-01-18 and last updated on our database on 2017-04-12 and is currently at version 2.5.
Thank you for downloading from SoftPaz! Your download should start any moment now. It would be great if you could rate and share:
Rate this software:
Share in your network:
5dchart Add-in for Excel Description
If your line of work entails analyzing financial data, strategic planning or creating scientific or building charts, then you are likely to need a tool that can display data in a way that you can interpret easily.
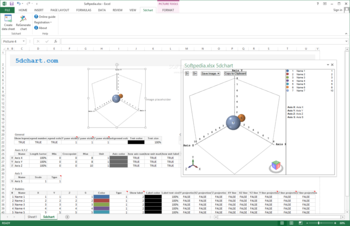
5dchart Add-in for Excel functions as a Microsoft Excel add-in that enables you to generate multidimensional graphs when selecting multiple cells featuring numeric data.
Seamless integration, no additional configuration
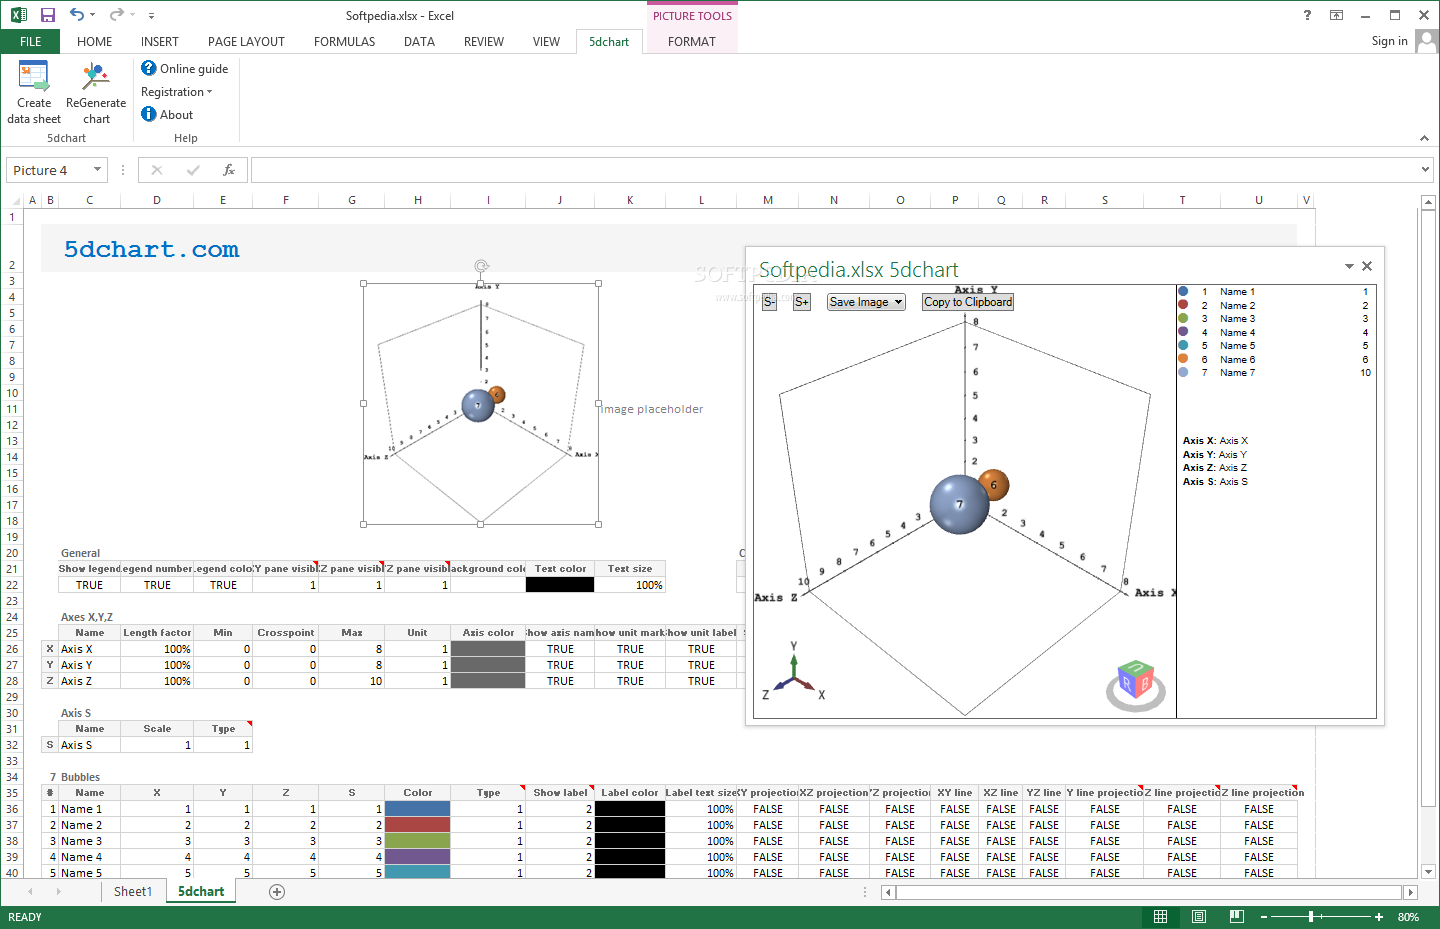
The utility can be accessed from Excel's toolbar, so it borrows its appearance and looks. While it entails typing parameters and values for 3D graphic representations, the UI is quite user-friendly and first-time users can effortlessly create impressive scatter plots.
The tool allows you to control all the elements in a 3D environment (surface projections, axes, positions, etc.), so the end-result depends on your ability to add the right values. After you are done, you can copy the image to clipboard.
Design charts with precise parameters
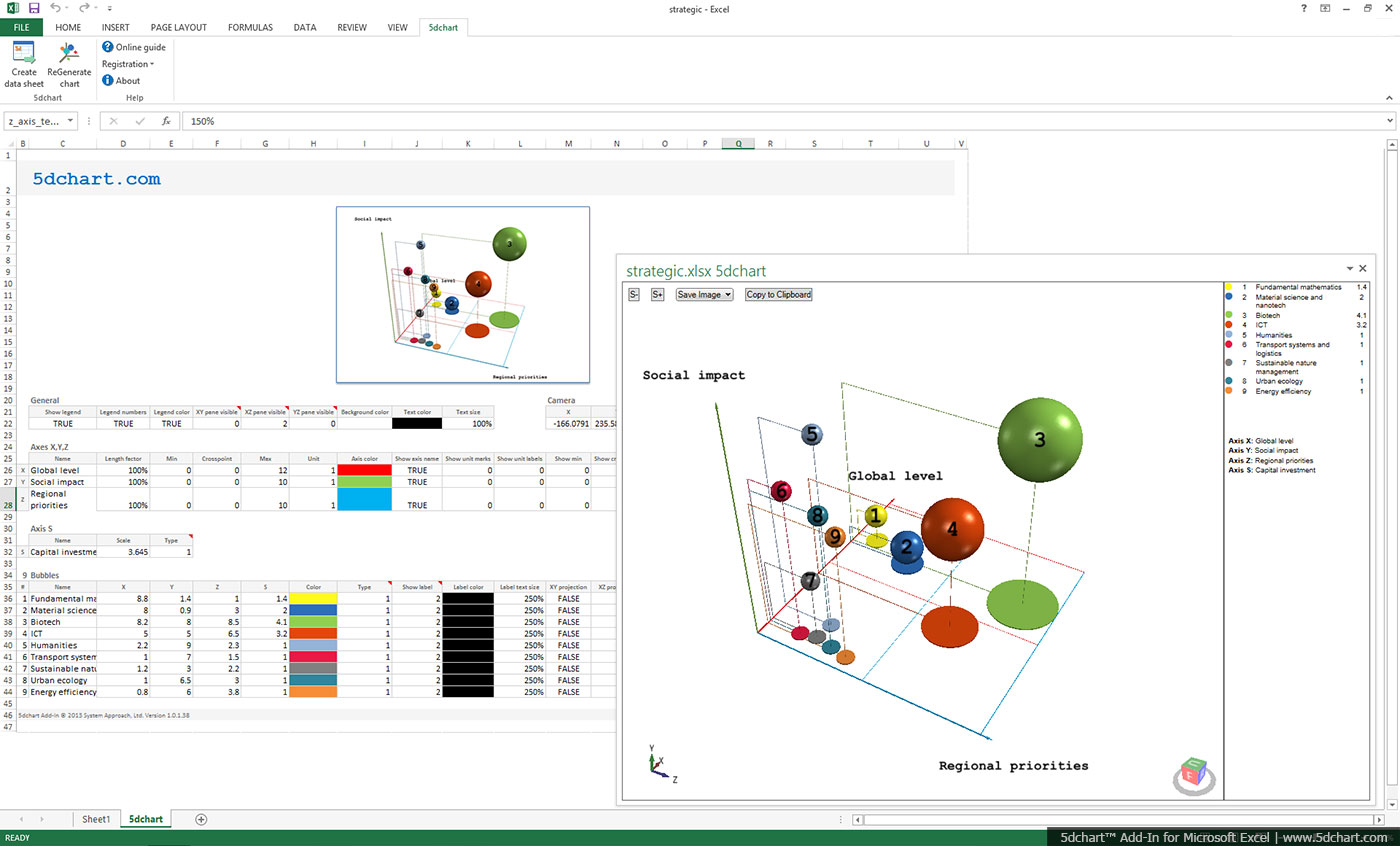
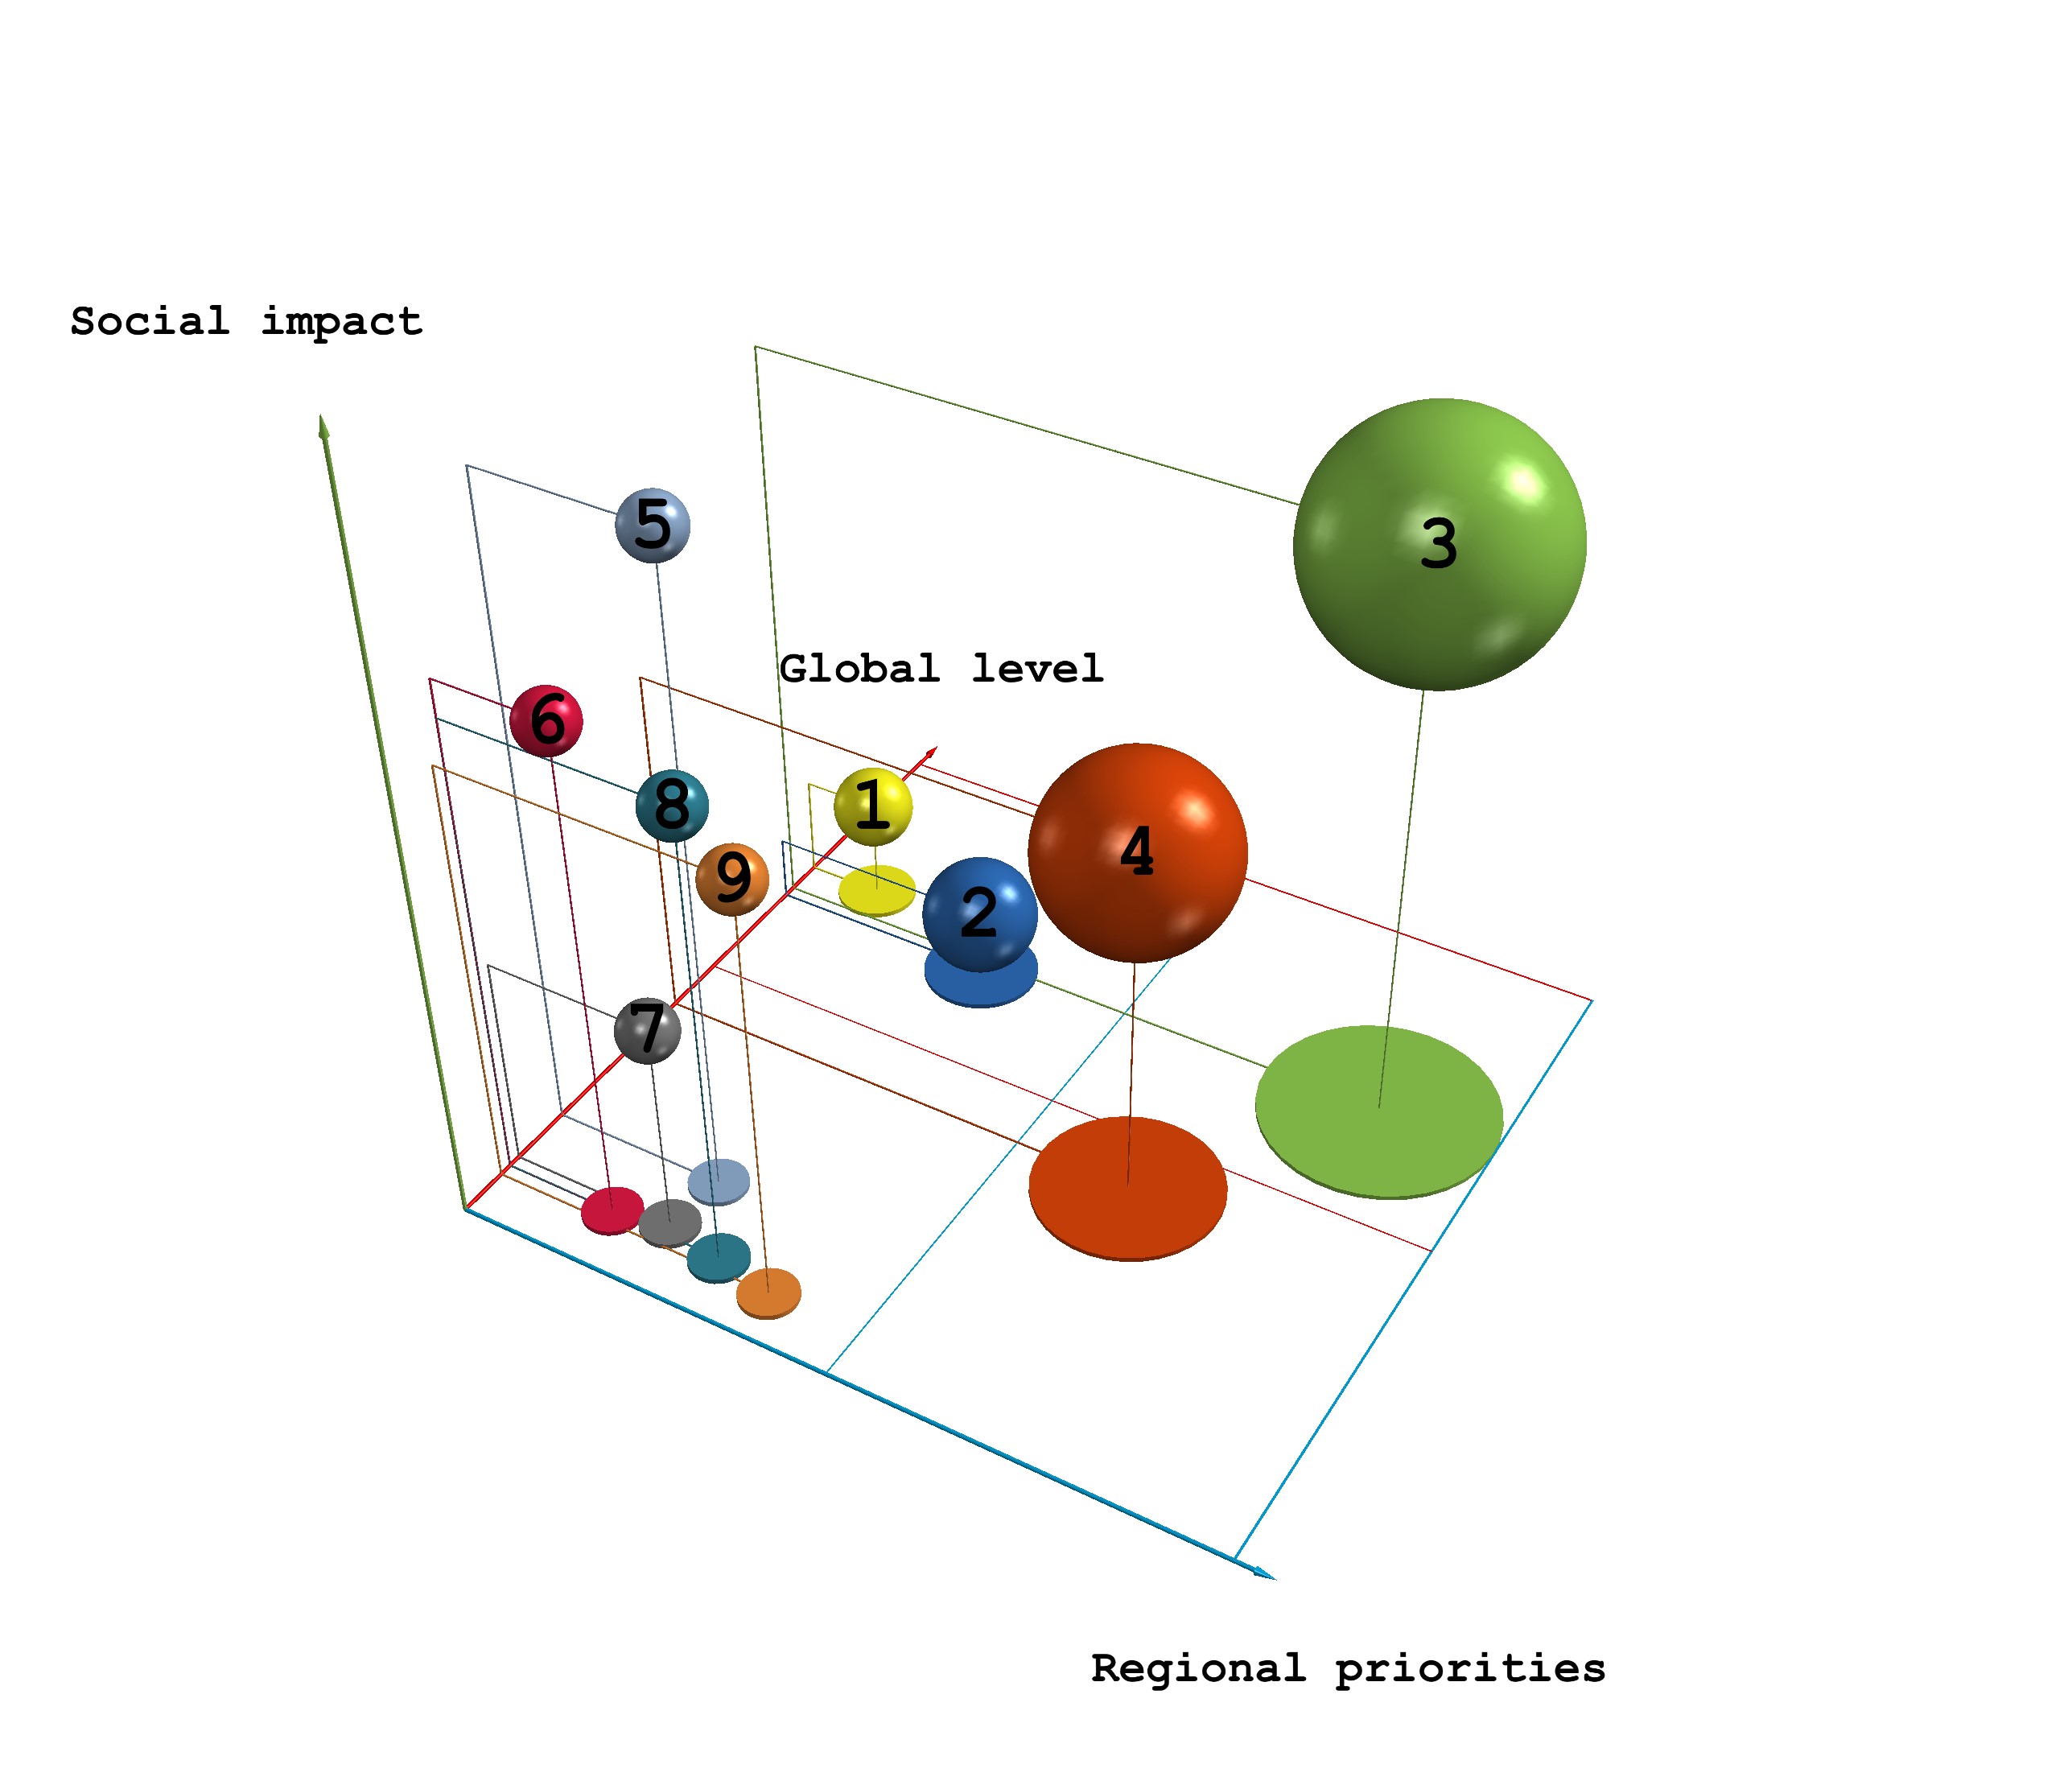
Not only does the application allow you to create 3D graphs directly in Excel, but it also allows you to specify the coordinates, sizes and colors of the bubbles used in the scatter plot.
This feature can surely come in handy when you are preparing a presentation and want to emphasize on the sales numbers or the company profit in a certain period, for instance.
It is necessary to mention that the before you can access the actual graphic, the utility asks you to create a data sheet linked to the initial data. You can customize and set your parameters from here before you access the ReGenerate chart function to view the 3D graph.
A useful tool for data analysis
In case you regularly work with large databases and you need to constantly analyze large amounts of data, then we do not need to tell you that graphic representations of data are a lot easier to understand than lists.
Since it can display data as 3D bubbles, 5dchart Add-in for Excel can help you interpret data faster and easier.
Where to buy?
Last updated price and discount information 9 years agoupdate now


 Windows Vista and above
 View Screenshots(3)
 Comments
 Download


 Similar Software
 Recently Searched
 Software Categories
 Trending Software


 Like Us


