Version: 1.1 Last Updated: 18 Feb 2017 Release: 12 May 2011 Category: Internet > WEB Design
Rate this software:
345 downloads
View Screenshots(2)
Comments
Download
Liked it? Tell others:
AnyChart Stock and Financial Flash Chart Details
Works on: Windows 10 | Windows 8.1 | Windows 8 | Windows 7 | Windows XP | Windows 2000 | Windows 2003 | Windows 2008 | Windows 98 | Windows ME | Windows Vista | Windows 2012 SHA1 Hash: 48d137a417edbc43c224e8edc5d29911be1f5711 Size: 1.92 MB File Format: zip
Rating: 2.52173913
out of 5
based on 23 user ratings
Publisher Website: External Link Downloads: 345 License: Demo / Trial Version
AnyChart Stock and Financial Flash Chart is a demo software by Anychart.com and works on Windows 10, Windows 8.1, Windows 8, Windows 7, Windows XP, Windows 2000, Windows 2003, Windows 2008, Windows 98, Windows ME, Windows Vista, Windows 2012.
You can download AnyChart Stock and Financial Flash Chart which is 1.92 MB in size and belongs to the software category WEB Design. AnyChart Stock and Financial Flash Chart was released on 2011-05-12 and last updated on our database on 2017-02-18 and is currently at version 1.1.
Thank you for downloading from SoftPaz! Your download should start any moment now. It would be great if you could rate and share:
Rate this software:
Share in your network:
AnyChart Stock and Financial Flash Chart Description
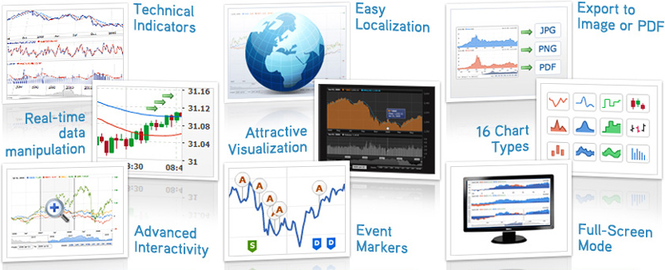
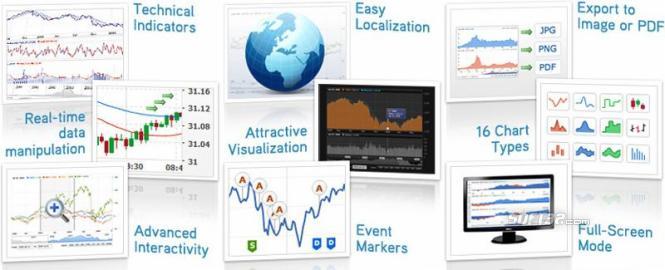
AnyChart Stock Component is a fully functional solution for solving the broadest range of data visualization problems. The component has numerous advantages over similar software, which excel it as a unique stock and financial charting solution on the market. While working on its functionality, we strove to make it comfortable and easy, so that you could work out the most sophisticated visualization tasks for large sets of financial data with little or no effort.
* Technical Indicators and Overlays - 12 fully customizable and automatically calculated technical indicators and overlays, which can be configured to suit your demands: Simple Moving Average, Exponential Moving Average, Bollinger Bands, Money Flow Index, MACD, Parabolic SAR, Rate of Change, Relative Strength Index, Stochastic Oscillator, Volume, Volume+MA, Williams %R
* Real-Time Data Streaming and Data Manipulations - a full feature set for creating real-time streaming and data manipulation applications. The Java Script library that comes with the component has methods that allow adding, updating, removing or inserting new data points or range of points.
* Advanced Interactivity, Rich Zooming, Scrolling and Navigation Options - all navigation elements meet all the industry's usability standards and are very comfortable in use.
* Drawing Tools for Technical Analysis -A complete list of drawing tools, giving end users an ability to add drawings to a chart such as Line segment, Ray, Trend line, Vertical Line, Horizontal Line, Rectangle, Ellipse, Triangle, Trend channel, Andrew's pitchfork, Fibonacci fan, Fibonacci arc, Fibonacci retracement, Fibonacci time-zones, Buy/Sell signals, Custom text labels and so on.
* Rich API, XML/JSON interface support
* Attractive and Flexible Visual Settings
* Export Chart as JPG, PNG or PDF
* Fourteen Chart Types, All Combinable
* Event Markers
* Advanced Date-Time Formatting
* Full Screen Mode
* and many other useful and exciting features.
Where to buy?
Last updated price and discount information 9 years agoupdate now


 Windows 98 and above
 View Screenshots(2)
 Comments
 Download


 Similar Software
 Recently Searched
 Software Categories
 Trending Software


 Like Us


