Works on: Windows 10 | Windows 8.1 | Windows 8 | Windows 7 | Windows XP | Windows 2000 | Windows 2003 | Windows 2008 | Windows Vista | Windows 2012 SHA1 Hash: 76b3a34360693a4f0fbf80888af1cb59f97dfa4d Size: 659.89 KB File Format: exe
Rating: 1.956521739
out of 5
based on 23 user ratings
Downloads: 329 License: Free
f(x)-Viewer is a free software by Steffen Schirmer and works on Windows 10, Windows 8.1, Windows 8, Windows 7, Windows XP, Windows 2000, Windows 2003, Windows 2008, Windows Vista, Windows 2012.
You can download f(x)-Viewer which is 659.89 KB in size and belongs to the software category Graphic. f(x)-Viewer was released on 2007-08-01 and last updated on our database on 2017-02-19 and is currently at version 2.
Thank you for downloading from SoftPaz! Your download should start any moment now. It would be great if you could rate and share:
Rate this software:
Share in your network:
f(x)-Viewer Description
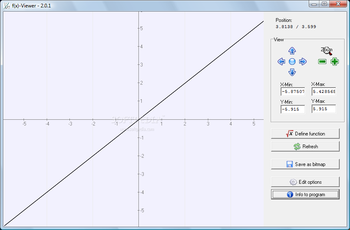
f(x)-Viewer is a lightweight software application developed specifically for helping you display simple and complex mathematical functions with the aid of graphs. The program eliminates the need of manually drawing curves because it provides a straightforward way to create precise diagrams. It can be deployed on all Windows versions out there.
Clean feature lineup
After a fast and simple installation process where you only need to press a few ‘Next’ buttons in order to bring the task to an end, you are welcomed by a well-organized suite of features. A help manual is not included in the package so you need to experiment a little bit with the dedicated parameters in order to understand how the program works. Only details about the supported mathematical functions are revealed and they are shown in German.
Check out various mathematical functions
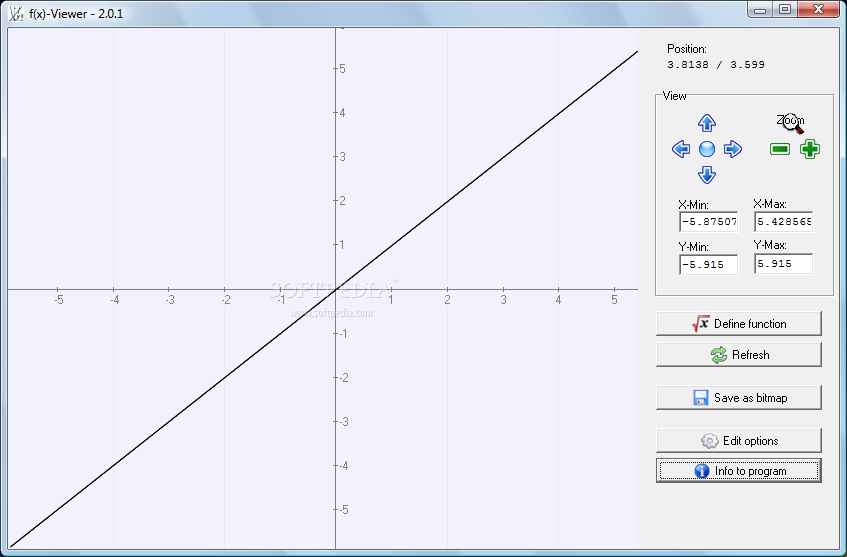
f(x)-Viewer gives you the possibility to view your current mouse position in the graph in real time. What’s more, you can make use of the built-in controls in order to center the graph in the main window or change the viewing mode to the left, right, bottom, or top part of the working environment.
Zooming actions are also implemented for helping you analyze a graph in detail. You are allowed to manually input the x and y coordinates, refresh the current graph data with a single click, as well as export the graph to BMP file format.
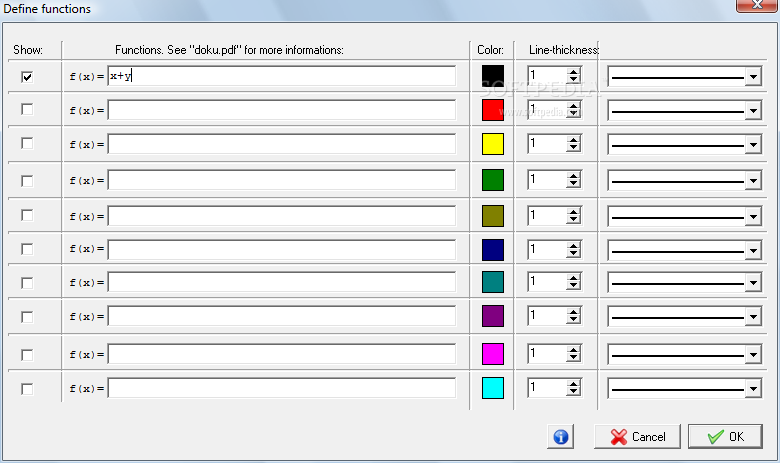
The application lets you define multiple functions. You can either type in the information directly in the dedicated fields or paste it from the clipboard. Each function can be altered in terms of color, line type, and line thickness.
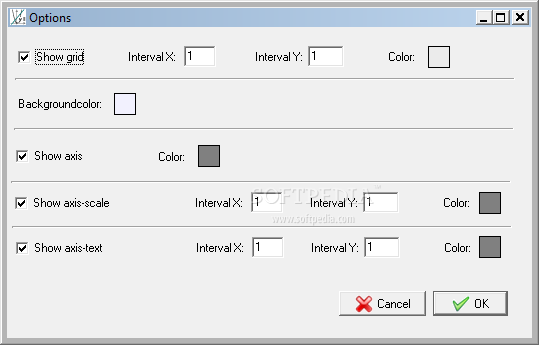
A few configuration settings are hidden under the hood for helping you show or hide the grid, set the color of the grid, specify the preferred background color, reveal or hide axis, scale of the axis, and text of the axis, and pick a user-defined color for the axis.
Tests have shown that f(x)-Viewer carries out tasks quickly. It is not a resource hog so you do not have to worry that it affects the overall performance of the PC.
Final remarks
All in all, f(x)-Viewer provides several straightforward and efficient tools for helping you visualize mathematical functions, and can be used by beginners and professionals alike.


 Windows XP and above
 View Screenshots(3)
 Comments
 Download


 Similar Software
 Recently Searched
 Software Categories
 Trending Software


 Like Us


