Works on: Windows 10 | Windows 8.1 | Windows 8 | Windows 7 | Windows XP | Windows 2000 | Windows 2003 | Windows 2008 | Windows Vista | Windows 2012 File Format: zip
Rating: 1.956521739
out of 5
based on 23 user ratings
Downloads: 465 License: Free
HeapMemView is a free software by Nir Sofer and works on Windows 10, Windows 8.1, Windows 8, Windows 7, Windows XP, Windows 2000, Windows 2003, Windows 2008, Windows Vista, Windows 2012.
You can download HeapMemView which is 45.06 KB in size and belongs to the software category Debuggers Decompilers Disassemblers. HeapMemView was released on 2013-09-04 and last updated on our database on 2017-03-29 and is currently at version 1.05.
We also have HeapMemView 64bit version which is 58.36 KB in size and will work on x64 computers.
Thank you for downloading from SoftPaz! Your download should start any moment now. It would be great if you could rate and share:
Rate this software:
Share in your network:
HeapMemView Description
HeapMemView is a feather-light and portable tool that lets you study information about memory blocks allocated in the heap of an active process. It comes in handy to software developers for identifying memory leaks in their products, in order to take the appropriate measures.
No-install application
Since there is no setup kit involved, you can save the app directory in any part of the HDD and just click the .exe to launch HeapMemView. Another possibility is to copy it to a USB flash drive, in order to directly run it on any machine with minimum effort and no previous installers. It doesn't change Windows registry settings.
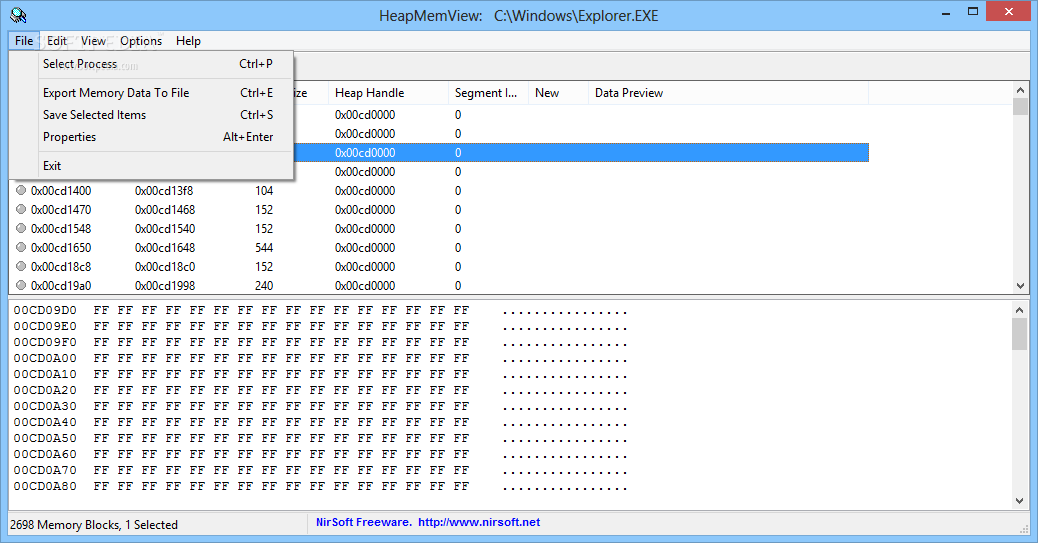
At startup, the program puts together a list with the currently running processes, including their icon, name and full path, asking you to pick the one you want to scrutinize for memory blocks.
View and save memory block information
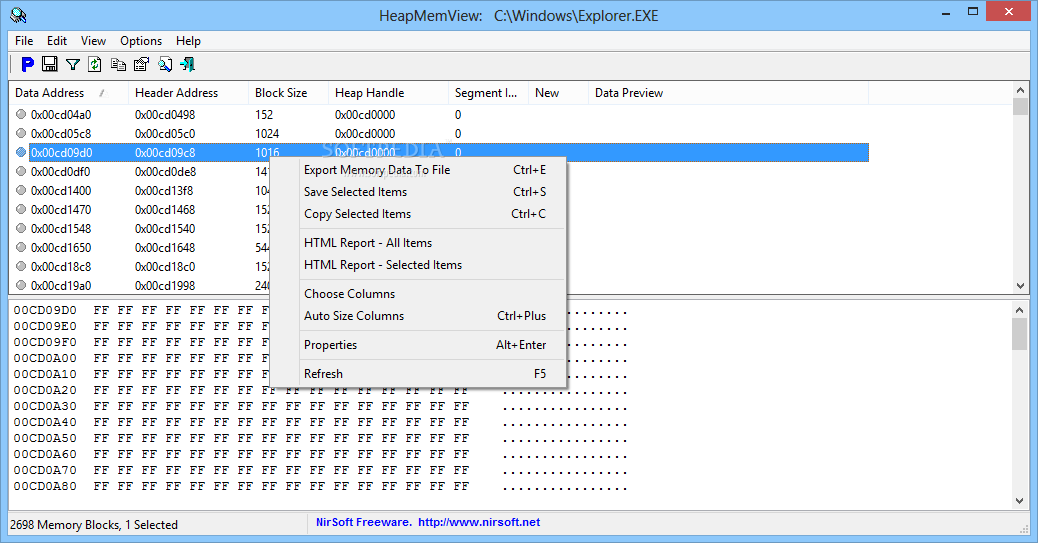
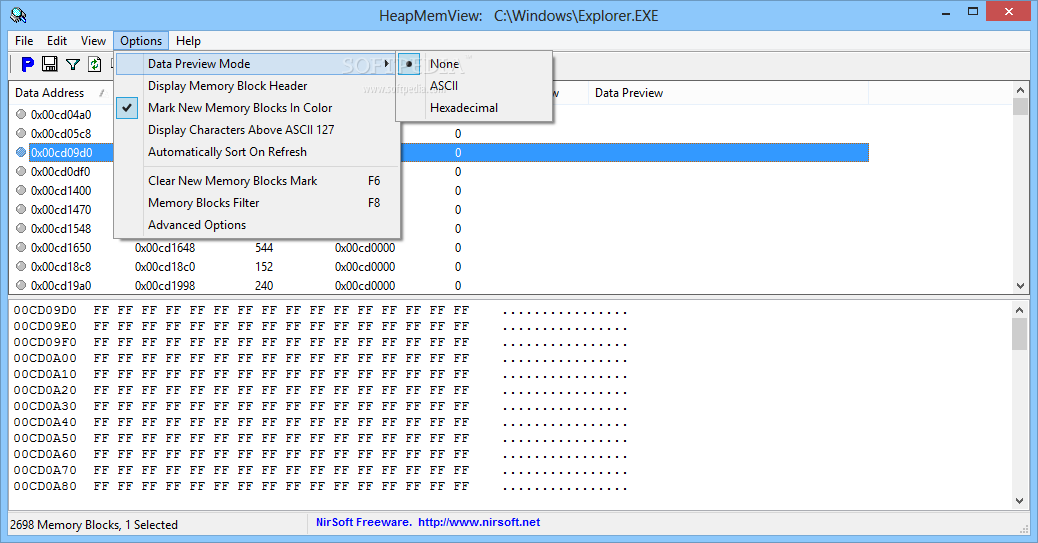
Information is immediately compiled and shown in the main window. Therefore, you can find out the data and header address, block size, heap handle, segment index, whether or not is new, along with the data preview of each block. The status bar reveals the total number of blocks.
Clicking an entry from the list displays the hexadecimal code of a block. An important aspect worth noting is that HeapMemView doesn't implement options for editing data, since it's a read-only app. It's possible to copy selected items or all information to the Clipboard or export it to file (HTML, TXT, XML, CSV), as well as export the memory data to file.
Customize program preferences
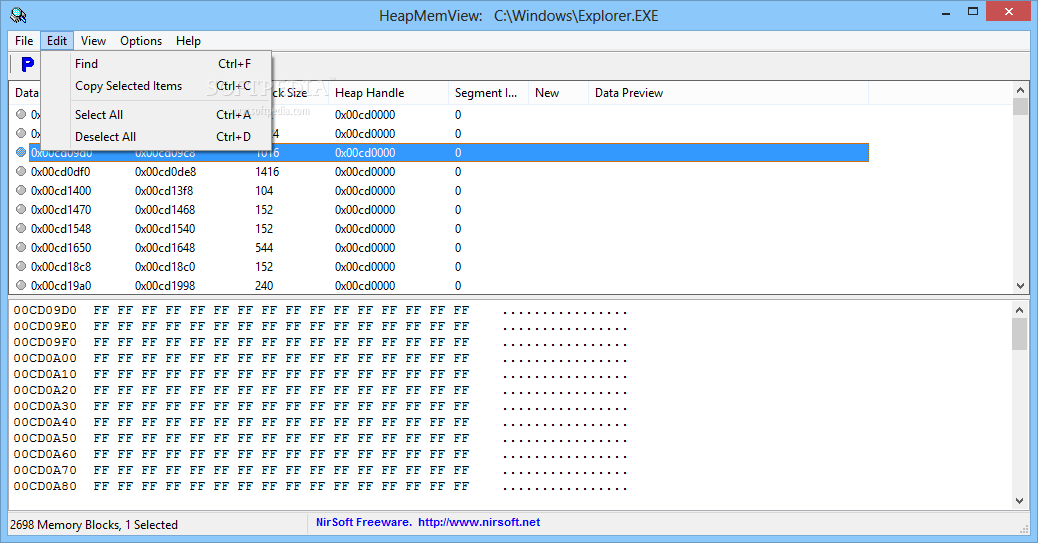
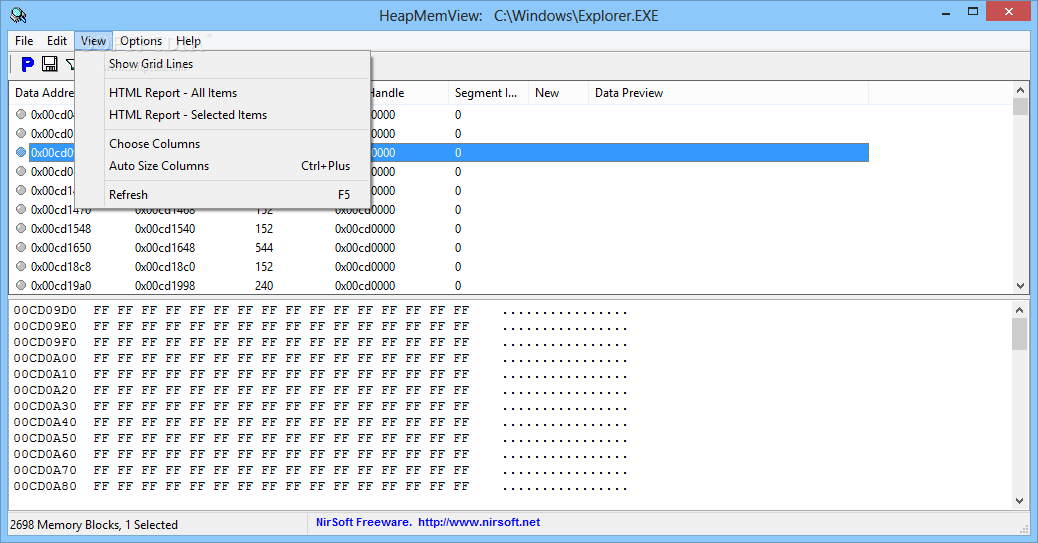
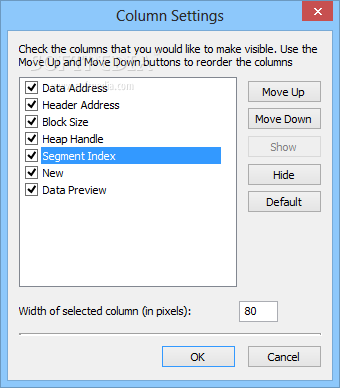
Furthermore, you can hide any columns from display, use a basic search function when handling large amounts of data, choose the data preview mode (ASCII or hexadecimal), show memory block headers, and easily spot new memory blocks, since they are listed in color.
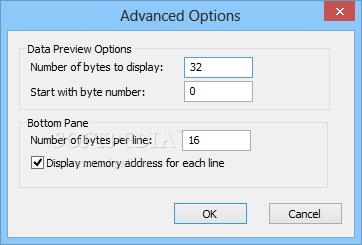
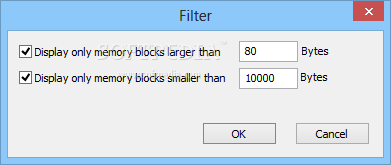
It's also possible to show characters in the memory headers above ASCII 127, automatically sort data on refresh, filter memory blocks by size, as well as configure advanced options concerning the number of bytes to display, byte number to start with, and number of bytes per line.
Evaluation and conclusion
No error dialogs popped up in our testing, and the application didn't freeze or crash. It compiled information immediately while remaining light on system resources usage, using low CPU and memory.
To sum it up, HeapMemView gives you a pretty good view of the memory blocks allocated in active processes, and it's equipped with plenty of customization options for software developers.


 Windows 2000 and above
 View Screenshots(8)
 Comments
 Download


 Similar Software
 Recently Searched
 Software Categories
 Trending Software


 Like Us


