IBM Pattern Modeling and Analysis Tool for Java Garbage Collector Details
Works on: Windows 10 | Windows 8.1 | Windows 8 | Windows 7 | Windows 2012 SHA1 Hash: 148f1cf6f0ced03f1f3467187cbc78ea8bac8a84 Size: 7.97 MB File Format: zip
Rating: 2.434782608
out of 5
based on 23 user ratings
Downloads: 503 License: Free
IBM Pattern Modeling and Analysis Tool for Java Garbage Collector is a free software by IBM Corporation and works on Windows 10, Windows 8.1, Windows 8, Windows 7, Windows 2012.
You can download IBM Pattern Modeling and Analysis Tool for Java Garbage Collector which is 7.97 MB in size and belongs to the software category Other Programming Files. IBM Pattern Modeling and Analysis Tool for Java Garbage Collector was released on 2010-05-25 and last updated on our database on 2017-02-27 and is currently at version 3.9.
Thank you for downloading from SoftPaz! Your download should start any moment now. It would be great if you could rate and share:
Rate this software:
Share in your network:
IBM Pattern Modeling and Analysis Tool for Java Garbage Collector Description
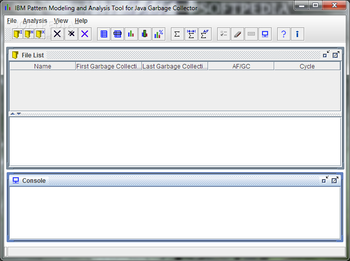
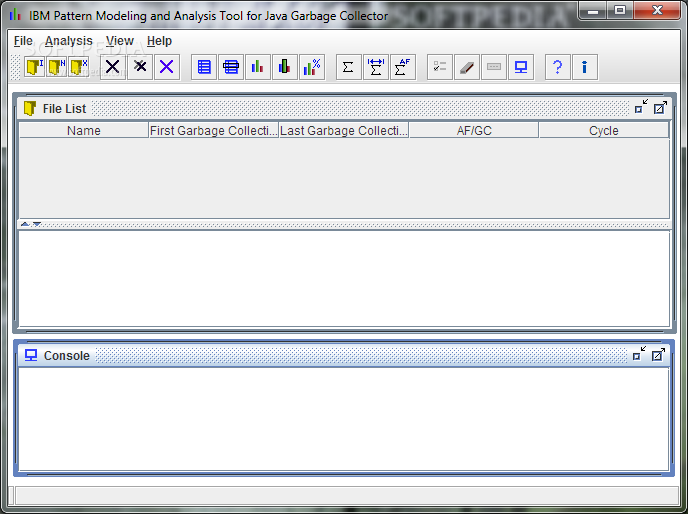
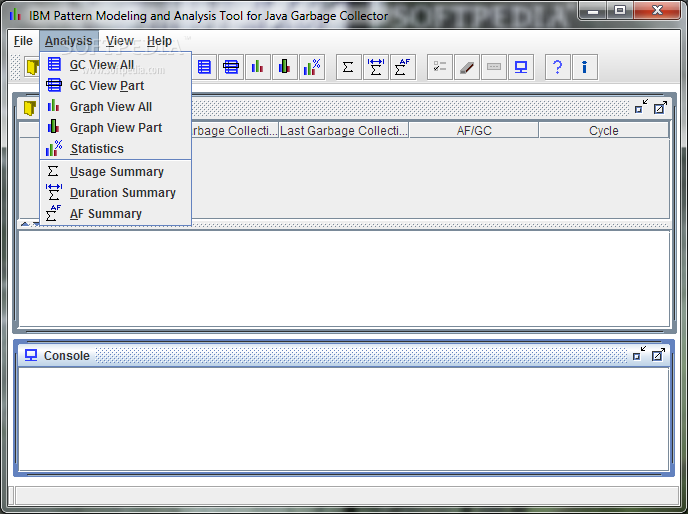
Pattern Modeling and Analysis Tool for IBM Java Garbage Collector (PMAT) parses verbose GC trace, analyzes Java heap usage, and recommends key configurations based on pattern modeling of Java heap usage.
When the JVM (Java virtual machine) cannot allocate an object from the current heap because of lack of space, a memory allocation fault occurs, and the Garbage Collector is invoked. The first task of the Garbage Collector is to collect all the garbage that is in the heap. This process starts when any thread calls the Garbage Collector either indirectly as a result of allocation failure or directly by a specific call to System.gc().
The first step is to get all the locks needed by the garbage collection process. This step ensures that other threads are not suspended while they are holding critical locks. All other threads are then suspended. Garbage collection can then begin. It occurs in three phases: Mark, Sweep, and Compaction (optional).
Verbose GC is a command-line option that one can supply to the JVM at start-up time. The format is: -verbose:gc or -verbosegc. This option switches on a substantial trace of every garbage collection cycle. The format for the generated information is not designed and therefore varies among various platforms and releases.
This trace should allow one to see the gross heap usage in every garbage collection cycle. For example, one could monitor the output to see the changes in the free heap space and the total heap space. This information can be used to determine whether garbage collections are taking too long to run; whether too many garbage collections are occurring; and whether the JVM crashed during garbage collection.
With IBM Pattern Modeling and Analysis Tool for Java Garbage Collector you get a powerful utility for heap analysis.
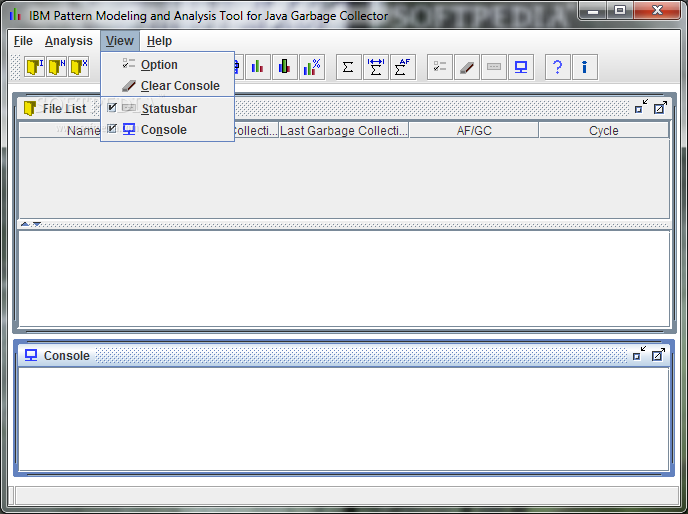
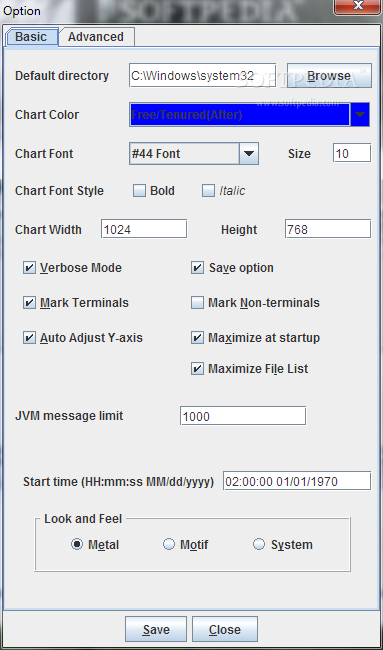
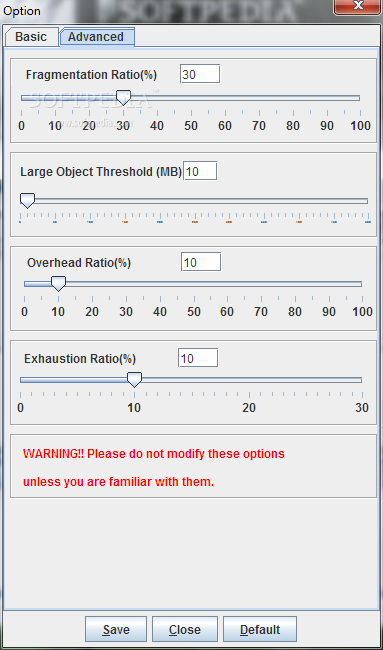
IBM Pattern Modeling and Analysis Tool for Java Garbage Collector Screenshots


 Windows 7 and above
 View Screenshots(5)
 Comments
 Download


 Similar Software
 Recently Searched
 Software Categories
 Trending Software


 Like Us


