Works on: Windows 10 | Windows 8.1 | Windows 8 | Windows 7 | Windows 2012 SHA1 Hash: 050b0bc0a148f9cb0f768806ce014204774c7a9b Size: 239.17 MB File Format: exe
Rating: 2.260869565
out of 5
based on 23 user ratings
Publisher Website: External Link Downloads: 943 License: Demo / Trial Version
Logger Pro is a demo software by Vernier Software and works on Windows 10, Windows 8.1, Windows 8, Windows 7, Windows 2012.
You can download Logger Pro which is 239.17 MB in size and belongs to the software category System Miscellaneous. Logger Pro was released on 2017-02-17 and last updated on our database on 2017-04-23 and is currently at version 3.13.
Thank you for downloading from SoftPaz! Your download should start any moment now. It would be great if you could rate and share:
Rate this software:
Share in your network:
Logger Pro Description
Student Friendly:
12 built-in, self-guided tutorials.
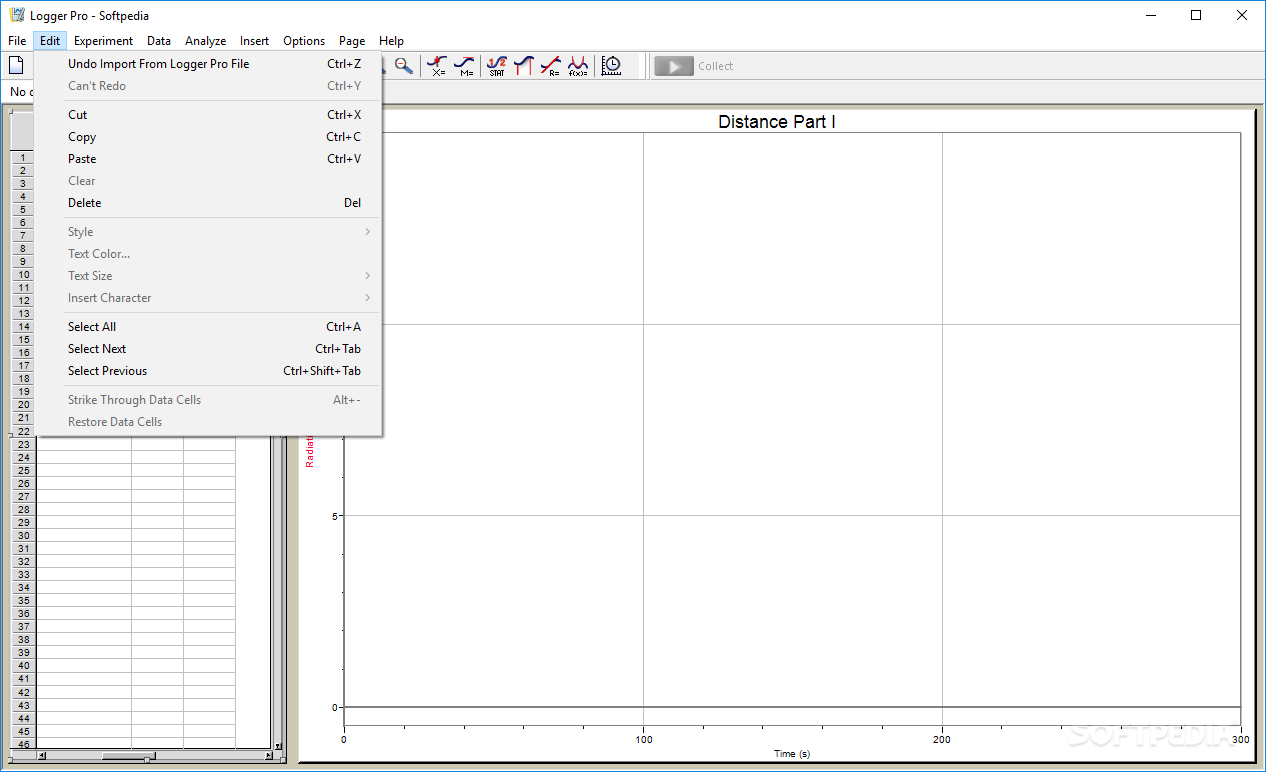
Write labs in Logger Pro or export data to Word or Excel.
Includes over 1,000 experiment files supported by our library of lab books.
Develop your own experiment files to match your curriculum
Versatile:
Supports over 70 Vernier sensors for real-time graphing and analysis.
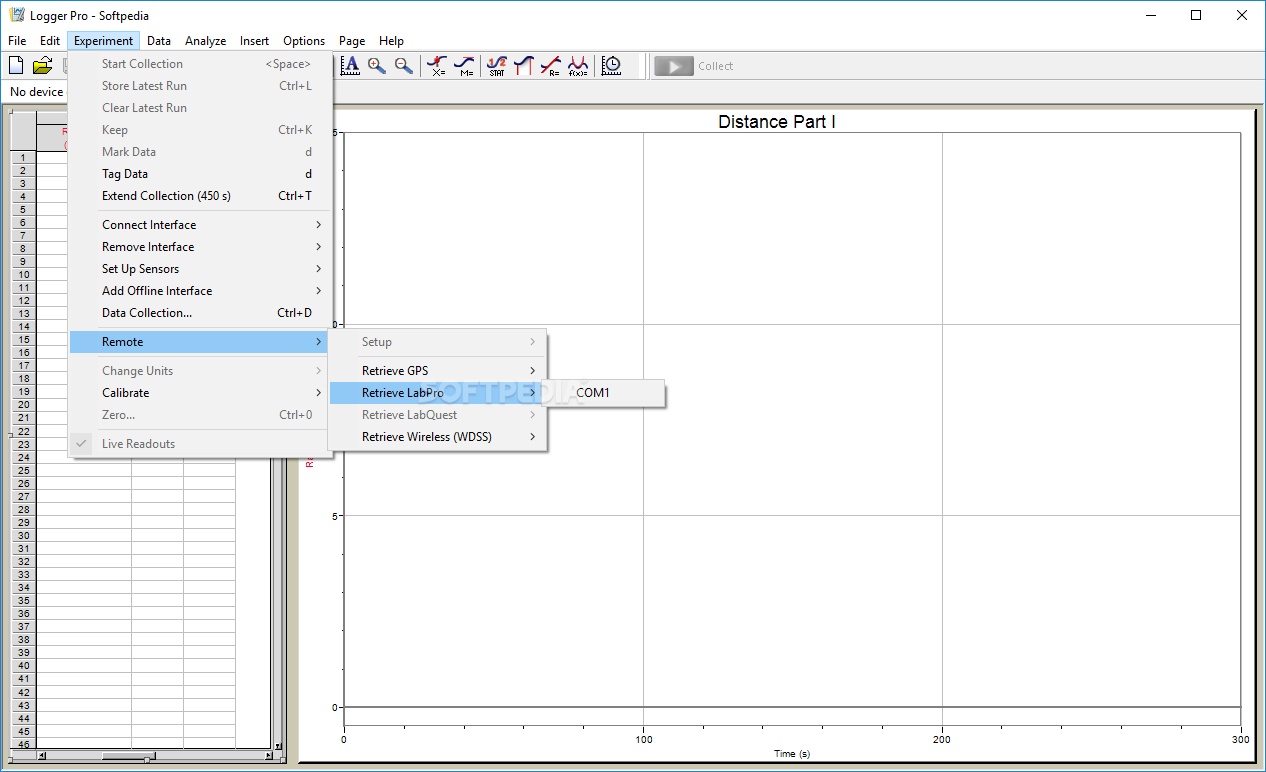
Collect data from a variety of sources, including LabQuest, LabQuest Mini, LabPro, WDSS, spectrometers, GPS, Ohaus balances, ProScope HR, and more.
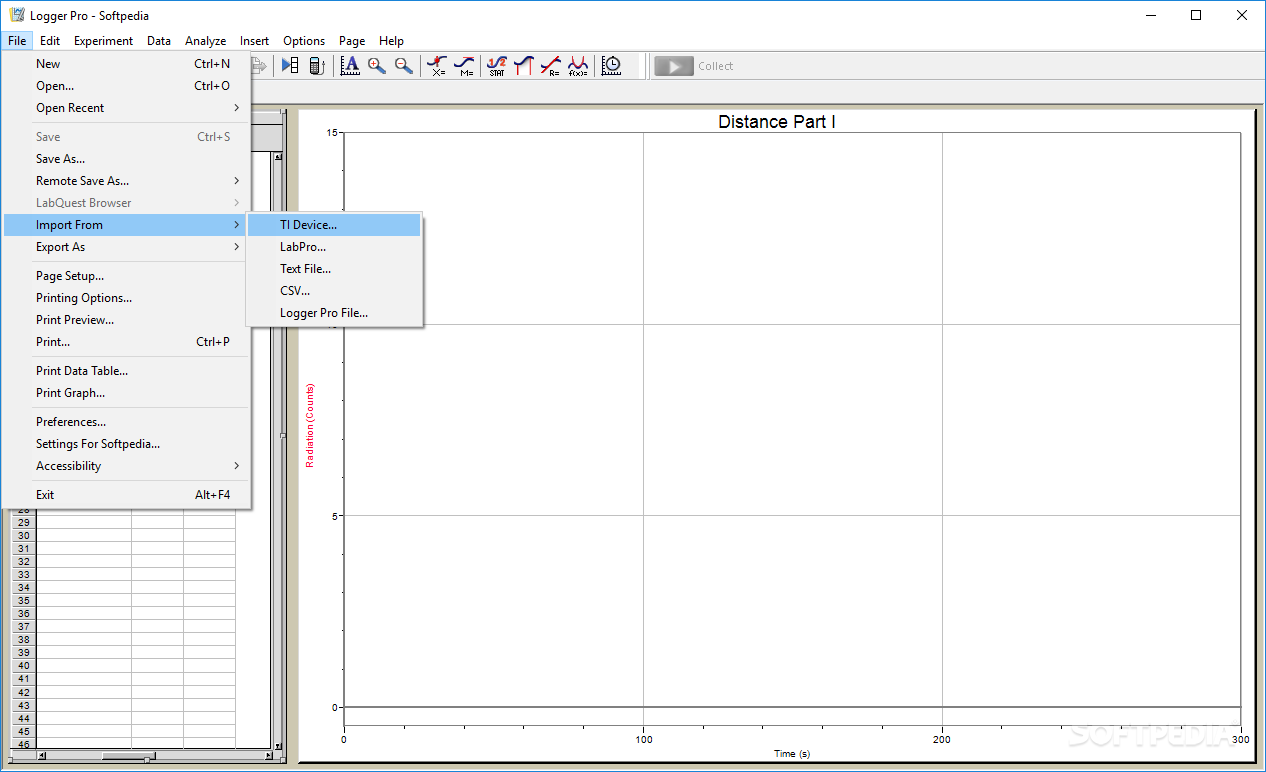
Enter values manually from existing data tables or import data.
Powerful:
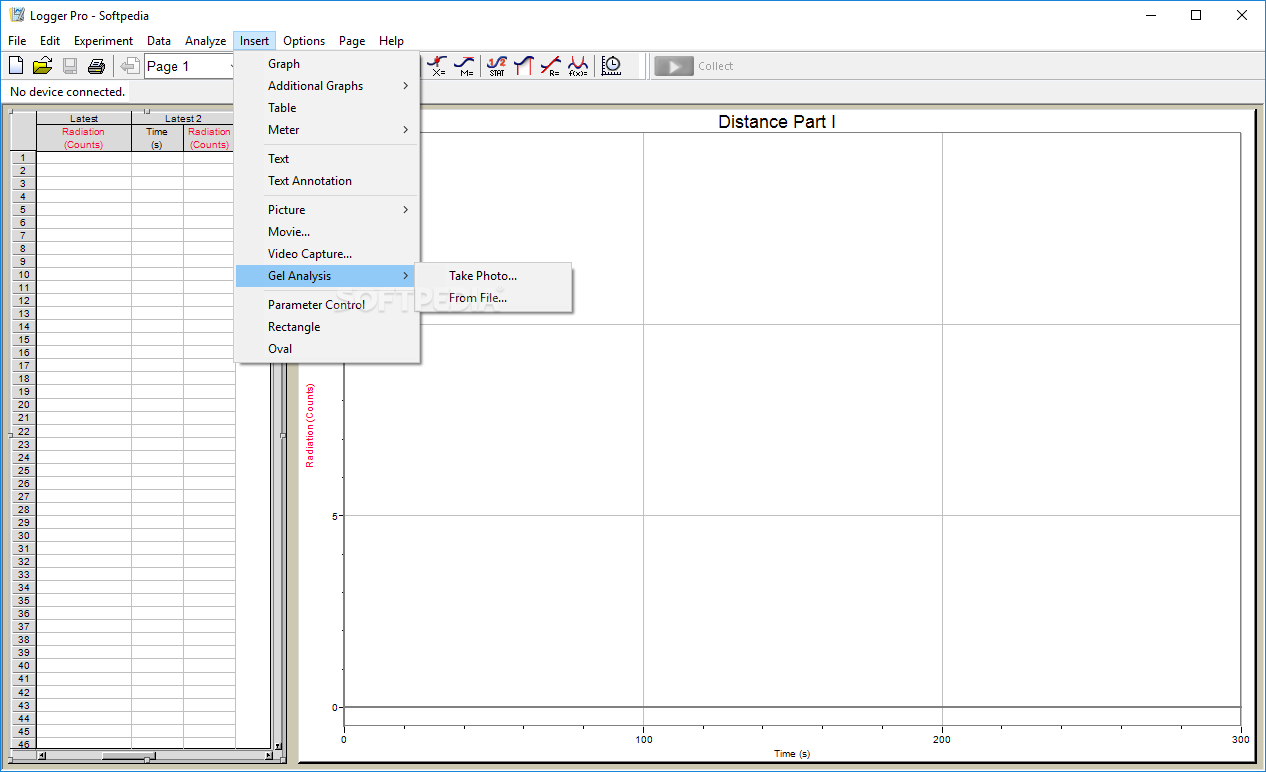
Capture videos to add a visual record of an experiment synchronized with your data.
Analyze a video frame by frame or take measurements from a still photo.
Draw predictions on graphs prior to data collection.
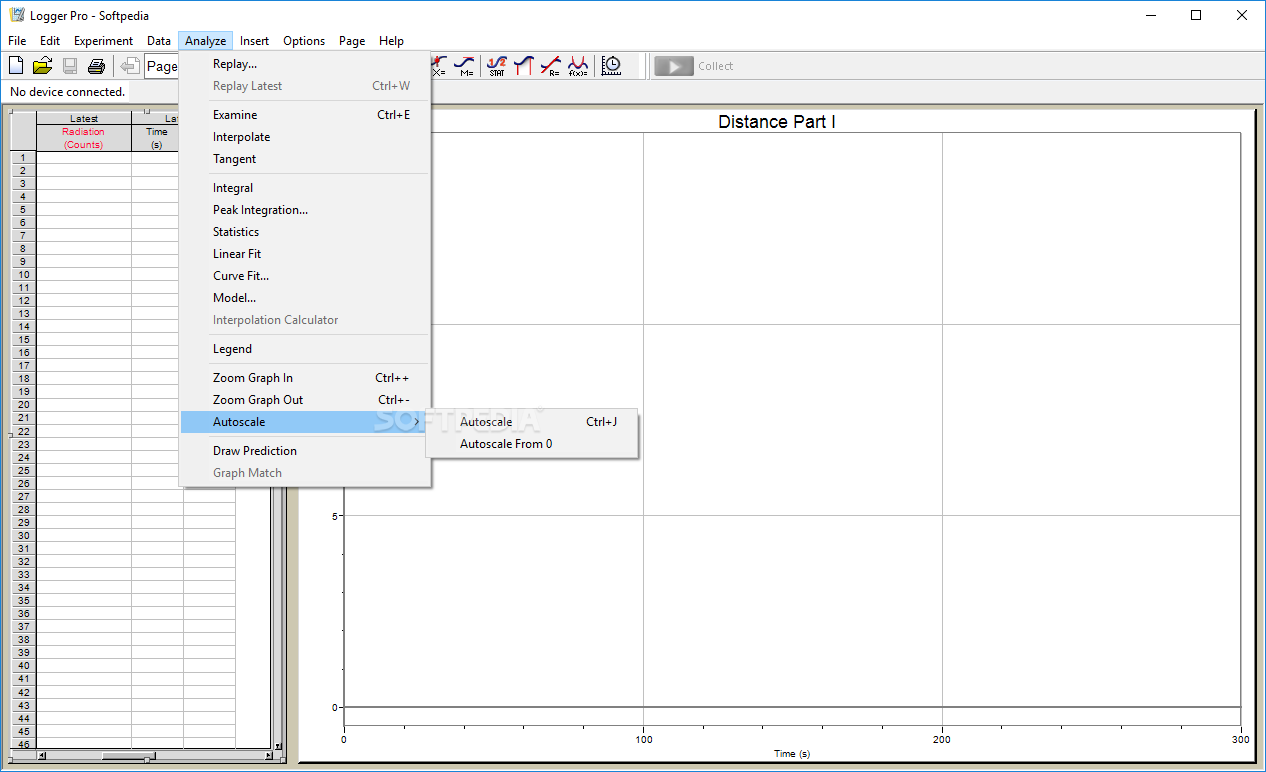
Perform statistical analysis of data, including integrals, tangents, curve fits, and more
Basic Features:
Auto-ID sensors make setup effortless.
Collect live data from more than 80 different sensors and devices.
Draw predictions on a graph before collecting data.
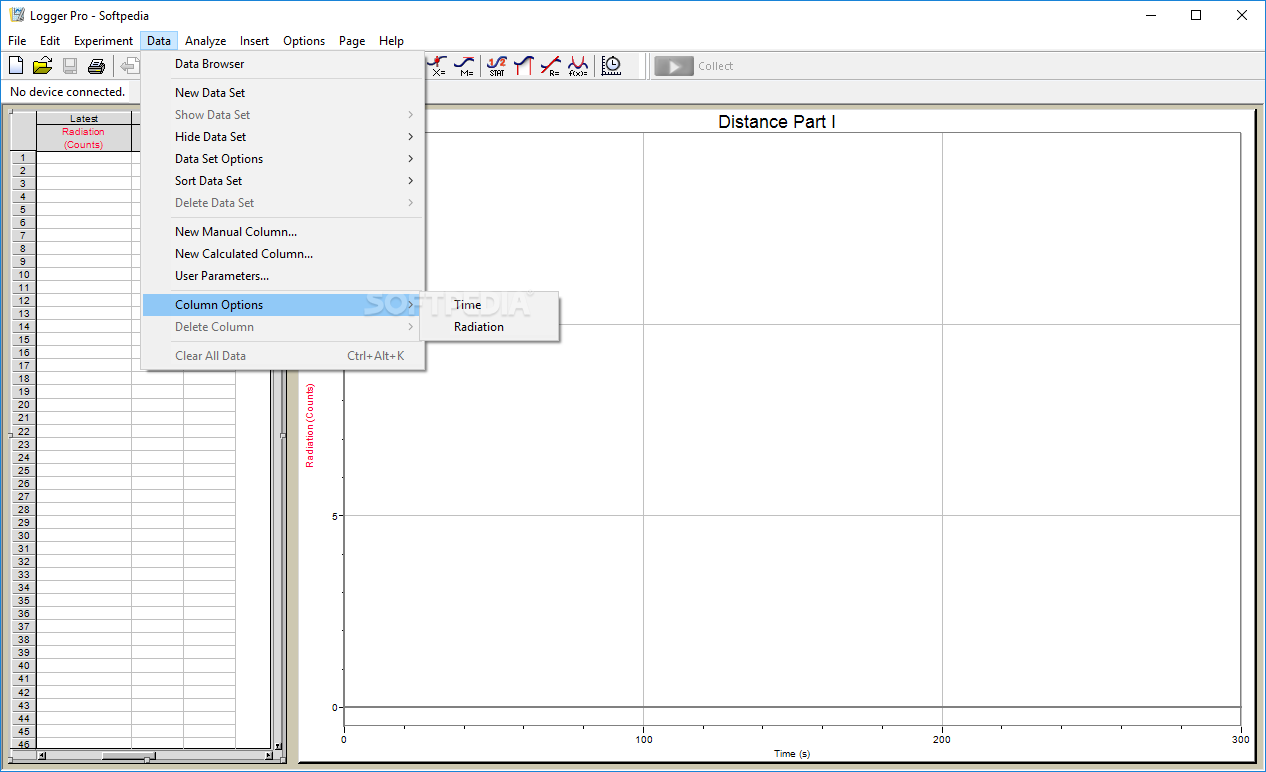
Use a variety of data-collection modes as needed for your experiment: time-based data, selected events, events with typed-in entries, photogate, radiation counting, and more.
Manually enter data for graphing and analysis.
Import data from Vernier interfaces.
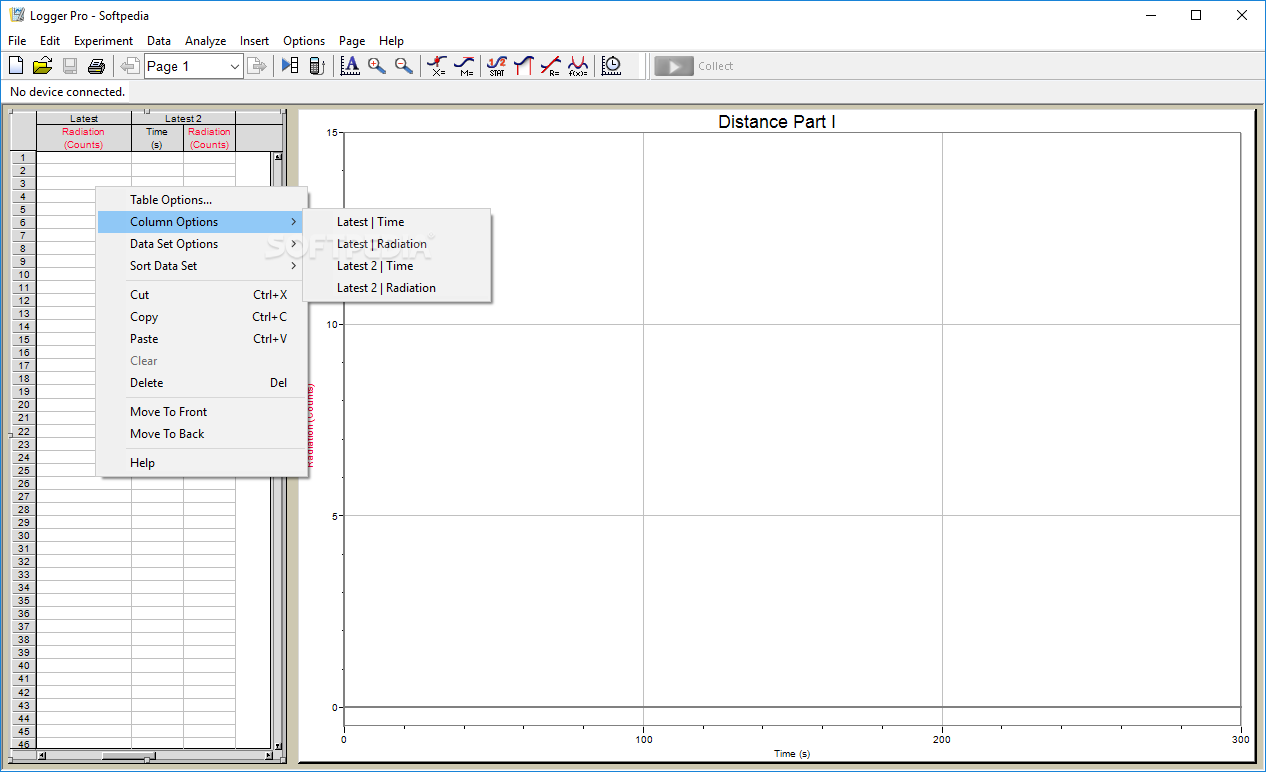
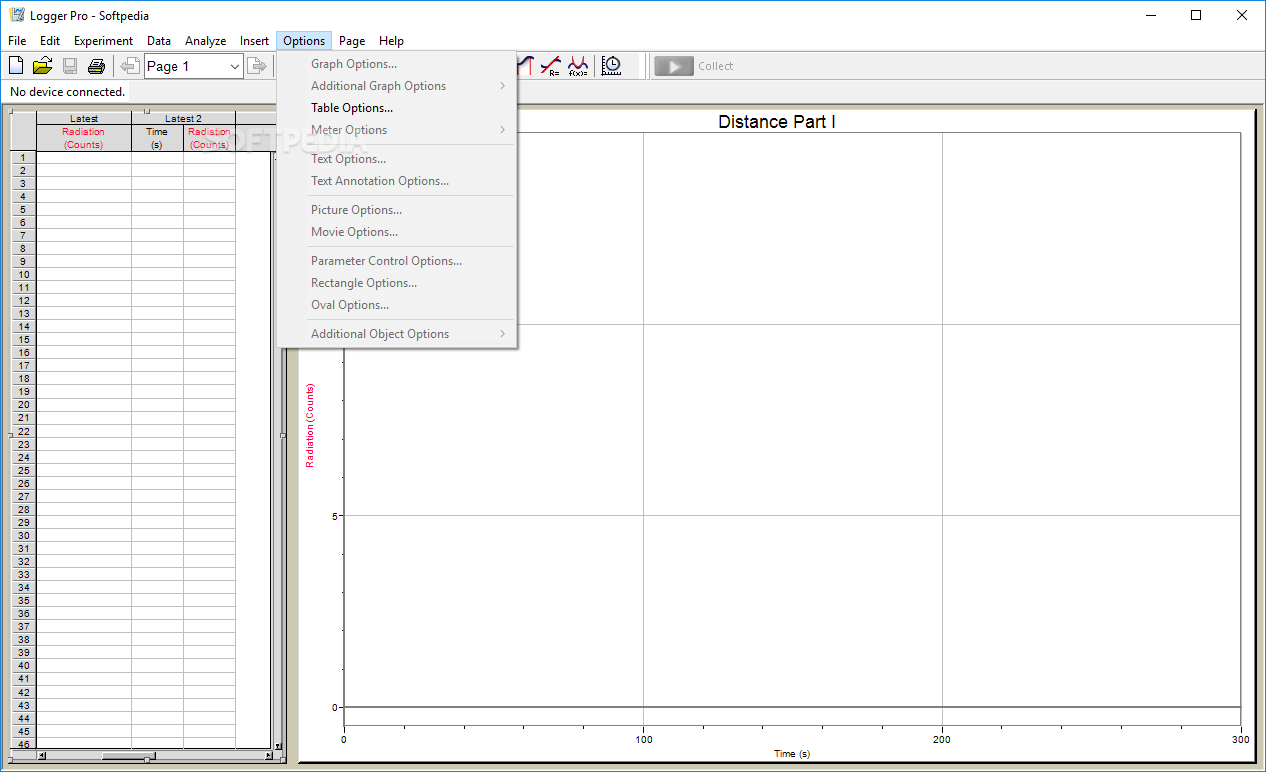
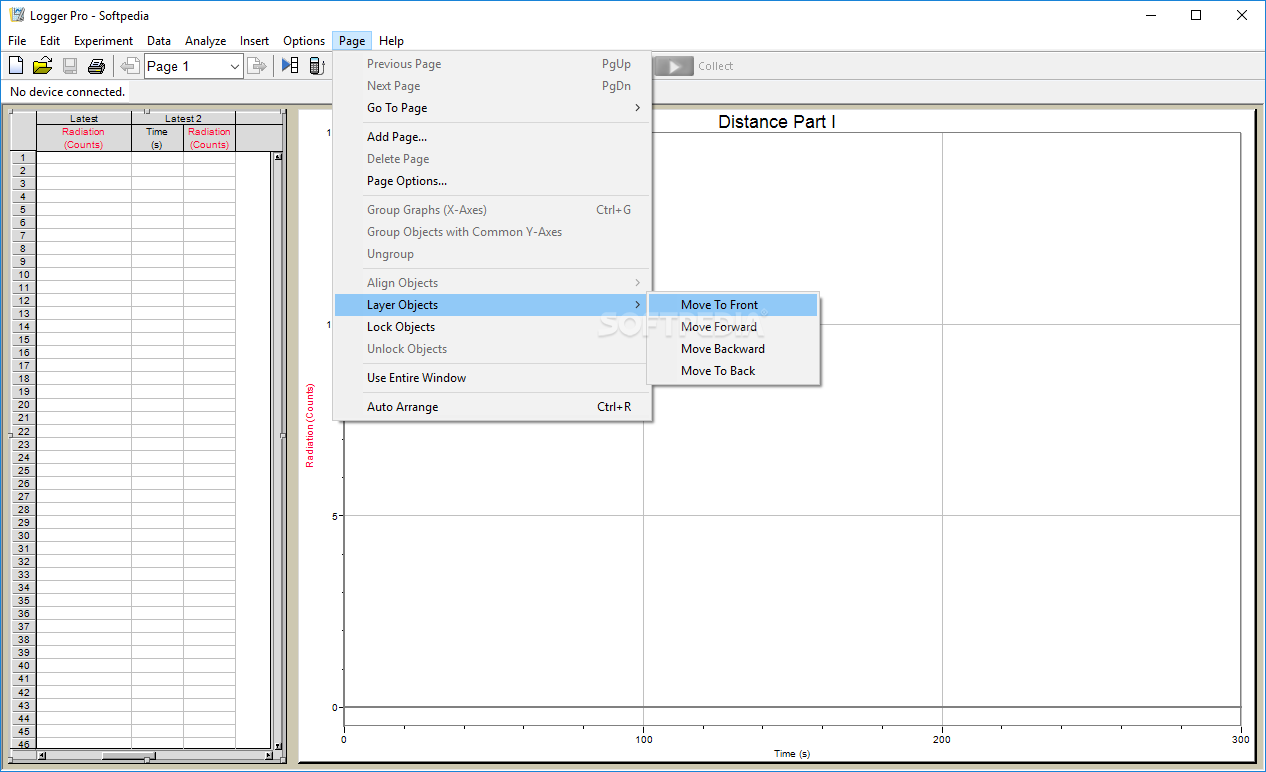
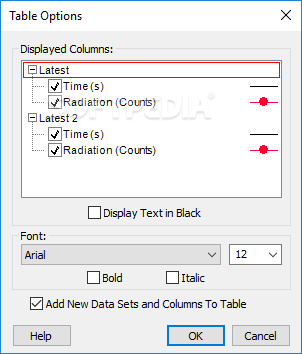
Lay out graphs, tables, and text as needed across multiple pages to describe your experiment.
Read values and slope from graphs using examine and tangent line tools.


 Windows 7 and above
 View Screenshots(10)
 Comments
 Download


 Similar Software
 Recently Searched
 Software Categories
 Trending Software


 Like Us


