Works on: Windows 10 | Windows 8.1 | Windows 8 | Windows 7 | Windows XP | Windows 2000 | Windows 2003 | Windows 2008 | Windows Vista | Windows 2012 SHA1 Hash: 06fb177e2966729f0e03ad9a3c0888fe395708fd Size: 266.19 KB File Format: zip
Rating: 2.130434782
out of 5
based on 23 user ratings
Downloads: 478 License: Free
NiceChart is a free software by Priyatna Harun and works on Windows 10, Windows 8.1, Windows 8, Windows 7, Windows XP, Windows 2000, Windows 2003, Windows 2008, Windows Vista, Windows 2012.
You can download NiceChart which is 266.19 KB in size and belongs to the software category Other Programming Files. NiceChart was released on 2007-08-18 and last updated on our database on 2017-02-20 and is currently at version 1.
Thank you for downloading from SoftPaz! Your download should start any moment now. It would be great if you could rate and share:
Rate this software:
Share in your network:
NiceChart Description
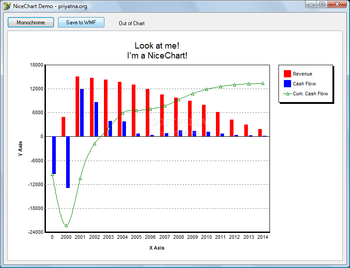
Once I need a chart component that can shows interpolated lines for one of my project. I dont need a sophisticated full-featured chart, I just need a simple one with basic functionalities. Dont find a way to do it with standard Delphi TChart component, I decided to write my own.
Currently it has three graph styles: lines, smooth lines with B-Splines, and bars. It has multilined title, legend, automatic y-axis, and supports multiple series. It also can produce a monochrome version of the graph using monochromatic brushes. Those features are sufficient for my programming needs.
I learned a lot from creating this component. I learned the algorithm to pick axis value range that are aligned to zero from an arbitrary set of values. I also learned some linear interpolation algoritms, although currently only B-splines that is accomodated in this component. And finally I understand why theres only a handful chart component out there.
There are some main methods of the component:
procedure BeginUpdate;
ï¿ Call this method to prevent control updating its content. This is useful when you want to add bulky data to the chart. Dont forget to call EndUpdate when you are done supplying data.
procedure EndUpdate;
ï¿ Call this method to reenable update. You must call BeginUpdate prior to call this method.
function AddSeries(AKind: TSeriesKind): TNiceSeries;
ï¿ Add a new series to the chart. A series can be a bar, line or smooth line type.
function ClientToChart(const X, Y: Integer; var AX, AY: Double): Boolean;
ï¿ Call this function to get X-axis and Y-axis value from mouse position. The X and Y parameters are the mouse position, and the corresponding X-axis and Y-axis values are stored in AX and AY variables. This function returns True if the supplied mouse position is within the X-axis and Y-axis range. Otherwise, it returns False.
procedure RemoveSeries(ASeries: TNiceSeries);
ï¿ Removes a series from the chart.
procedure Clear;
ï¿ Removes all series from the chart.
function CreateMetafile: TMetafile;
ï¿ Creates metafile (WMF) from the chart. This function is useful when you want to save the content of the chart to a file.
procedure CopyToClipboard;
ï¿ Copies the content of the chart to the clipboard. The content can be pasted in any application as a graphic image.


 Windows XP and above
 View Screenshots(1)
 Comments
 Download


 Similar Software
 Recently Searched
 Software Categories
 Trending Software


 Like Us


