Works on: Windows 10 | Windows 8.1 | Windows 8 | Windows 7 | Windows XP | Windows 2000 | Windows 2003 | Windows 2008 | Windows Vista | Windows 2012 SHA1 Hash: 565b22640d0507e8002dce84633f0e03fc0f8617 Size: 13.45 MB File Format: zip
Rating: 2.478260869
out of 5
based on 23 user ratings
Downloads: 1615 License: Free
G*Power is a free software by Department of Psychology and works on Windows 10, Windows 8.1, Windows 8, Windows 7, Windows XP, Windows 2000, Windows 2003, Windows 2008, Windows Vista, Windows 2012.
You can download G*Power which is 13.45 MB in size and belongs to the software category Science CAD. G*Power was released on 2014-03-29 and last updated on our database on 2017-03-30 and is currently at version 3.1.
Thank you for downloading from SoftPaz! Your download should start any moment now. It would be great if you could rate and share:
Rate this software:
Share in your network:
G*Power Description
In order to determine the status of an ongoing activity you might need to view statistics and this is easily achievable with the help of applications. G*Power is an easy to use application especially designed for statistics aficionados and students that can offer users power analysis tools for different statistical tests.
Perform various statistics operations
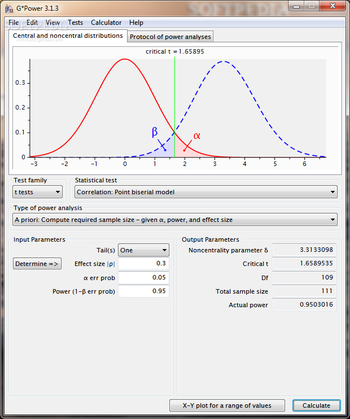
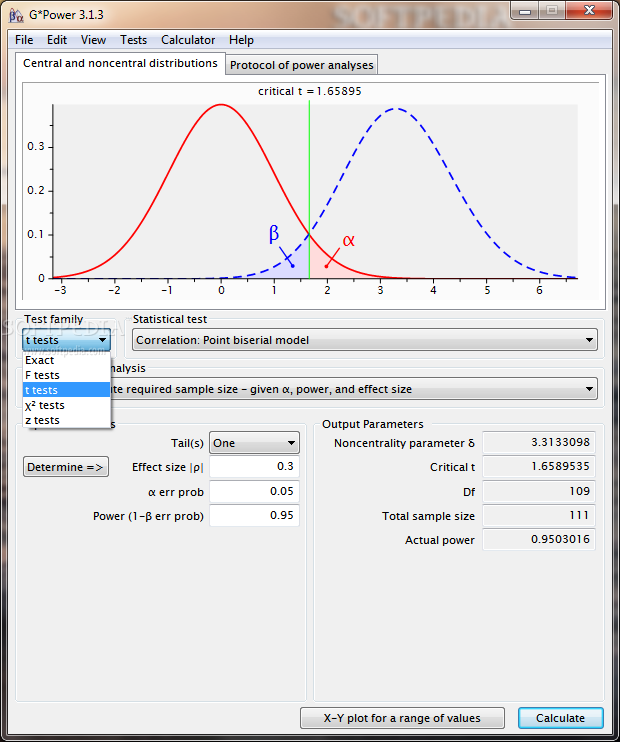
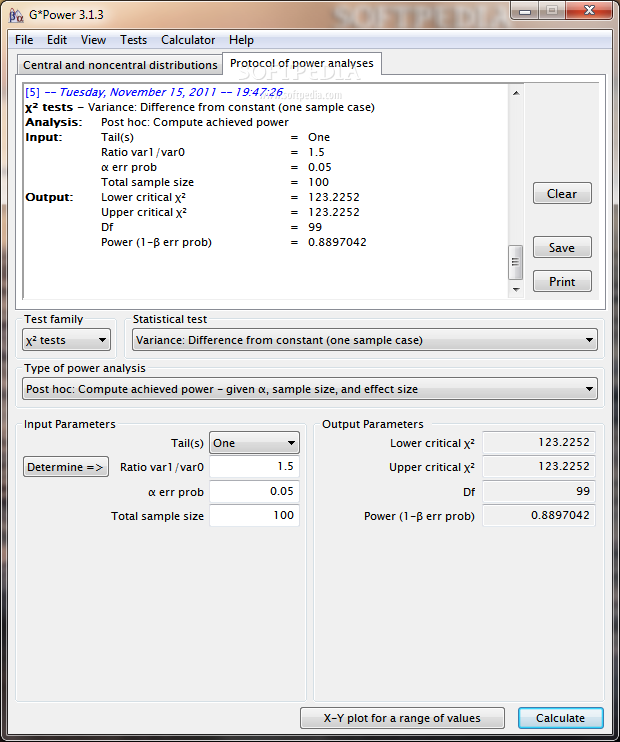
The application is very easy to use, as you just have to choose the appropriate test type and the desired parameters using the drop-down menus. It can perform calculations for F, t and χ2 tests, z test families and some exact tests. The calculation and graph plotting is done in seconds.
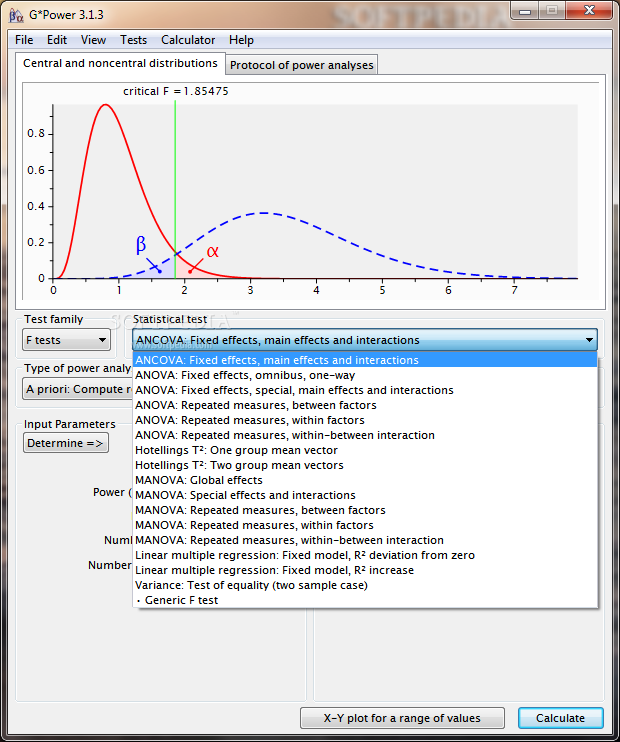
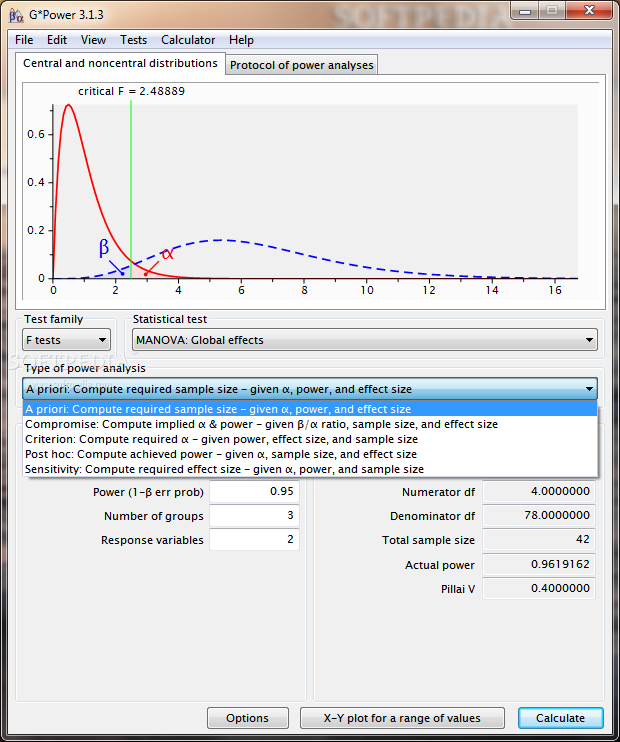
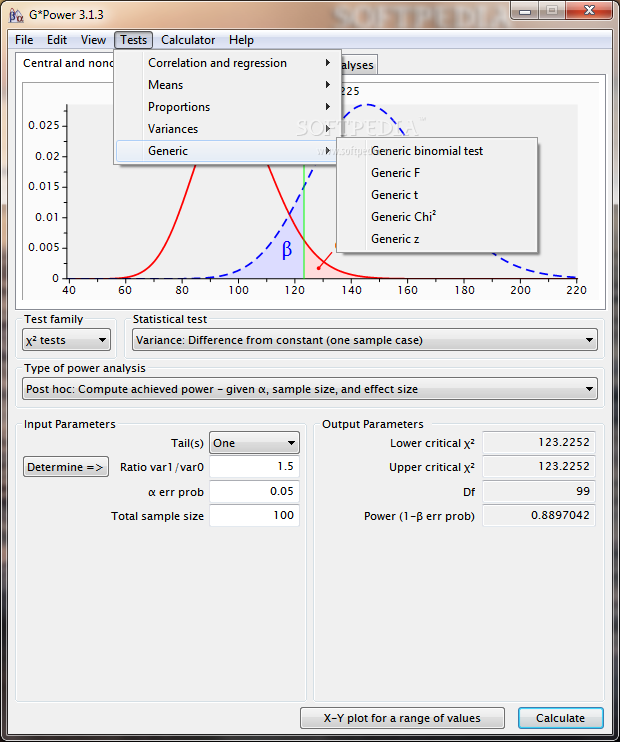
There are several statistical tests that the program supports, depending on the test family you choose. It can perform correlation, regression, means, proportion, variances and other tests using five different types of power analysis.
Quick generation and export of data
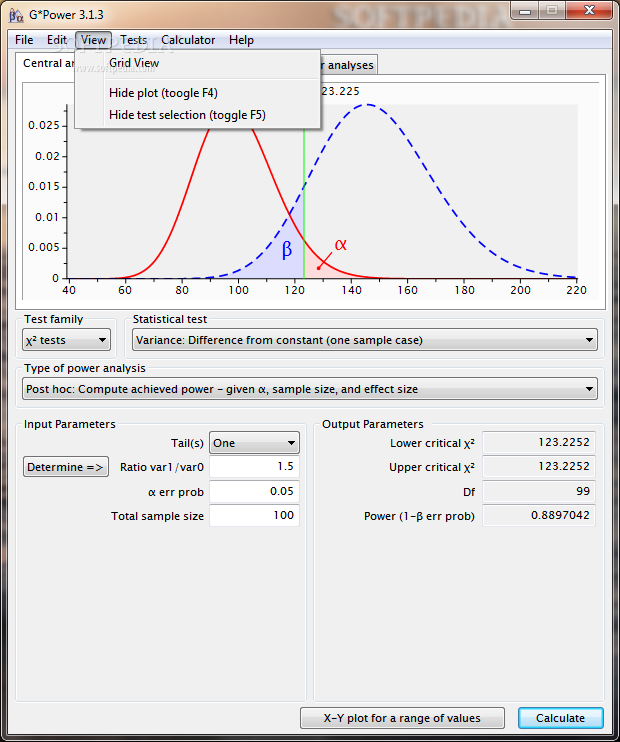
After setting the required input parameters (which can also be automatically determined based on observed frequencies or probabilities), press the 'Calculate' button and you're done! The central and non-central distribution is displayed in a graph, while the output parameters are calculated in a separate grid.
G*Power offers you the possibility to generate a bi-dimensional plot for a user-defined range of values. The distribution plot can be copied to clipboard or saved for later reference. In addition to this, you can view, save or print a log of every analysis you made.
Easily determine probabilities
A probability calculator is also included, which you can use to view the result of any number of input mathematical and statistical expressions. The displayed result is set to the value of the last one you write, while between the expressions you can add comments to state your objective.
To end with
While it can be used by statistical offices or research institutions, G*Power is a useful tool that can help teachers explain statistics better and students learn on their own without much effort. It does not require much time to get acquainted with its features, providing the desired result in no time.


 Windows XP and above
 View Screenshots(7)
 Comments
 Download


 Similar Software
 Recently Searched
 Software Categories
 Trending Software


 Like Us


