Works on: Windows 10 | Windows 8.1 | Windows 8 | Windows 7 | Windows XP | Windows 2000 | Windows 2003 | Windows 2008 | Windows Vista | Windows 2012 SHA1 Hash: 687c3639b1cd9f2daec1e5833e82f5d3dab15b5d Size: 8.7 MB File Format: zip
Rating: 2.260869565
out of 5
based on 23 user ratings
Publisher Website: External Link Downloads: 487 License: Demo / Trial Version
Stock Investment Guide is a demo software by Churr Software and works on Windows 10, Windows 8.1, Windows 8, Windows 7, Windows XP, Windows 2000, Windows 2003, Windows 2008, Windows Vista, Windows 2012.
You can download Stock Investment Guide which is 8.7 MB in size and belongs to the software category Finances and Business. Stock Investment Guide was released on 2015-08-02 and last updated on our database on 2017-04-06 and is currently at version 4.
Thank you for downloading from SoftPaz! Your download should start any moment now. It would be great if you could rate and share:
Rate this software:
Share in your network:
Stock Investment Guide Description
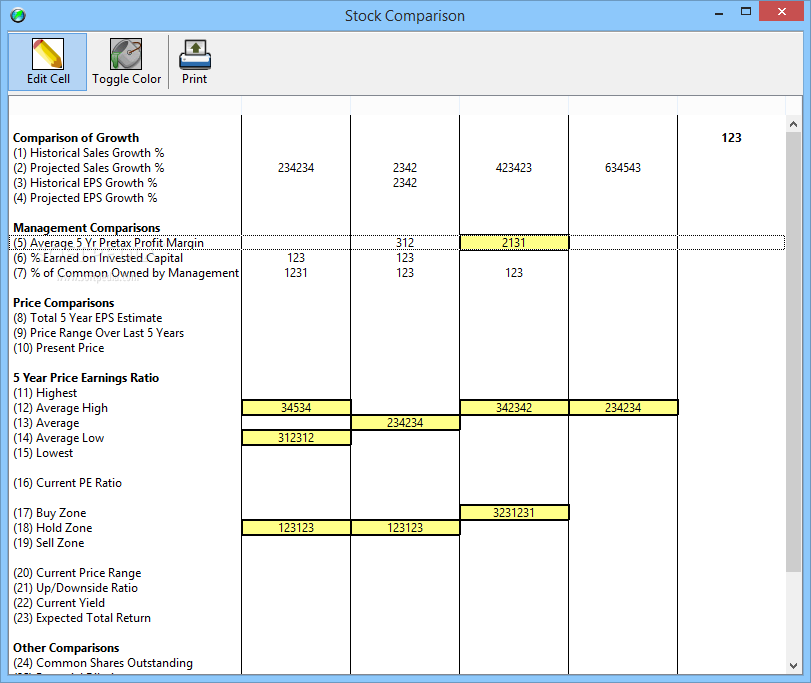
Performs fundamental stock club securities analysis
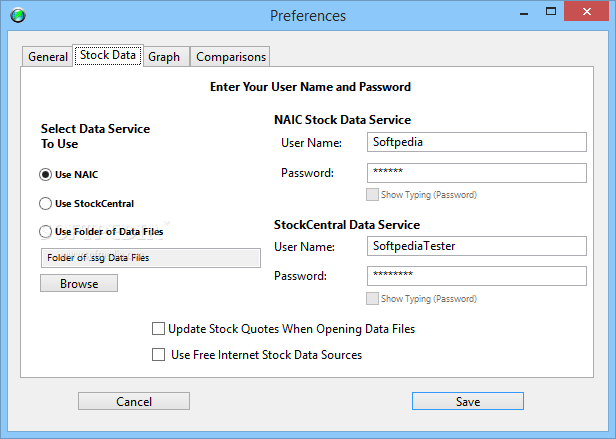
Integrated stock data with the Better Investing Stock Data Service
Automatically download a company description from the Stock Data Service
Automatically download a company's Sector and Industry
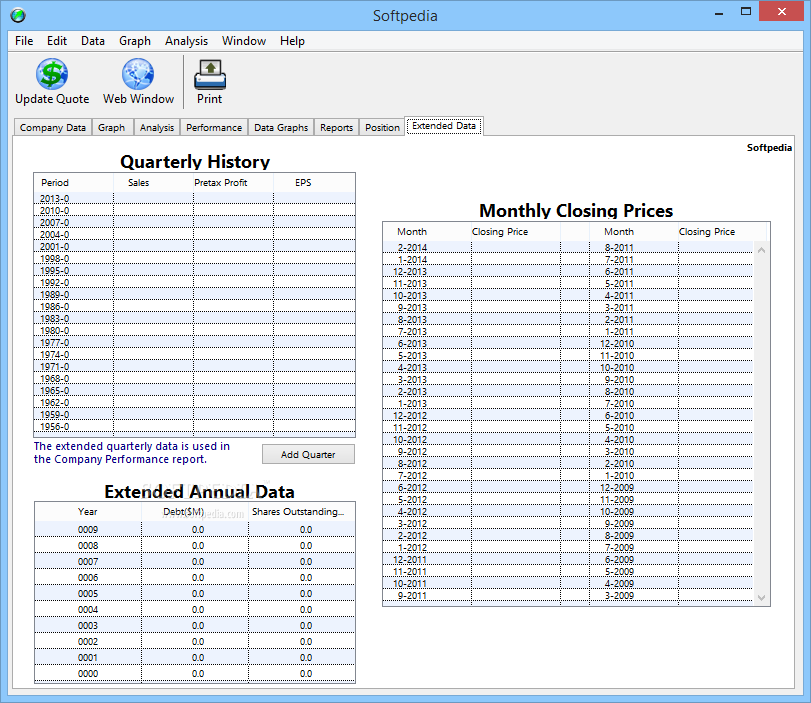
Ability import data files from Stock Central
Ability to download free data from the internet (minimal data needed to initially assess a stock)
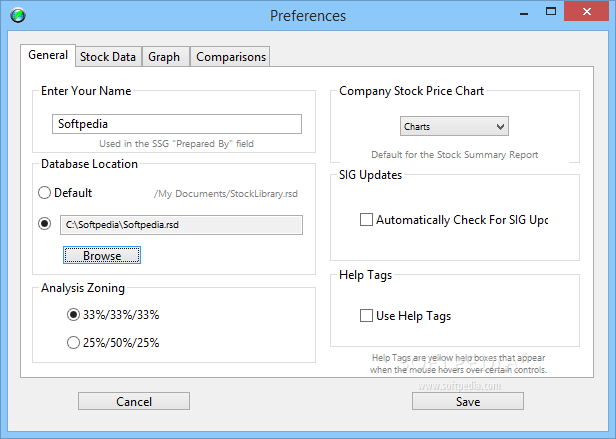
Save analysis in the standard .SSG file format
Import .SSG data files from fellow club members
Keep notes about your analysis and assumptions
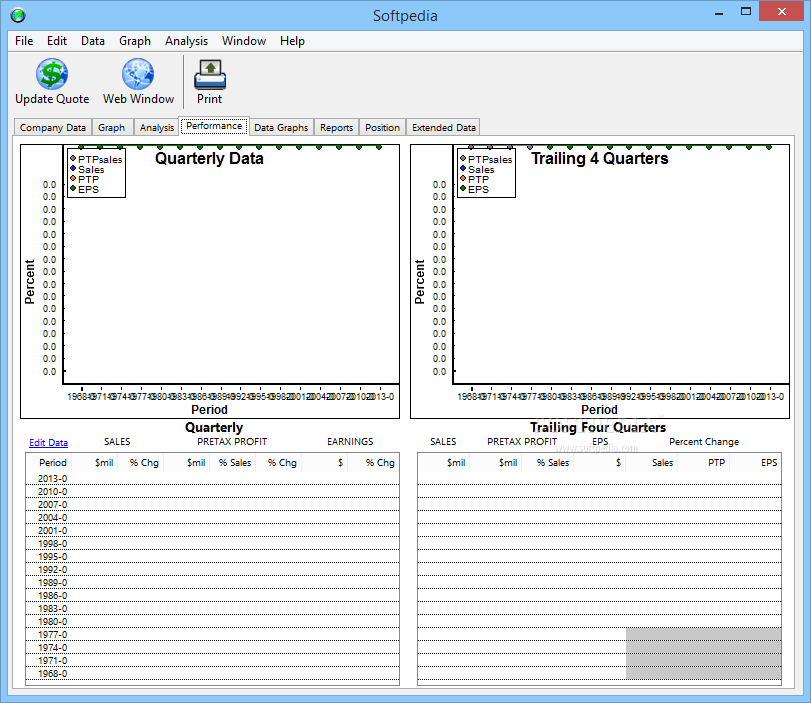
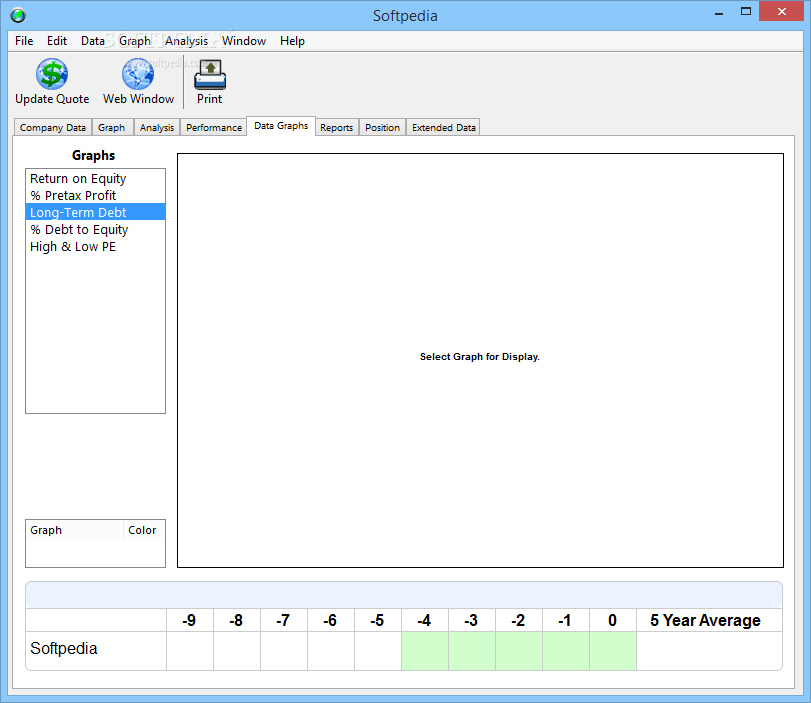
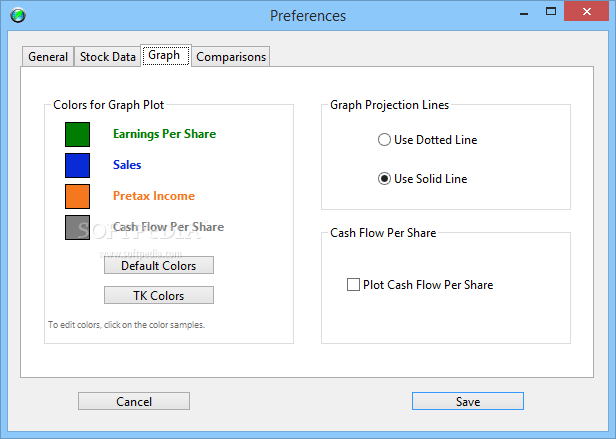
Semi-logarithmic graph of Sales, Pretax Profits, Earnings Per Share, and Cash Flow per Share
Ability to omit "outlier" years by clicking on a year's label in the graph
Scale plot values within the graph, and the number of cycles (vertical scale) of the graph
Plot additional quarterly results, and project future sales and earning from the most recent quarter versus last year
Customize plot colors used in the Graph (in preferences)
Omit by clicking on year labels in the Analysis calculations (Performance, Price and Earnings History)
Omit individual High or Low PEs by clicking on a cell of the Price and Earnings History table
Performs the preferred method calculations for the projected PE ratio
Plot company performance per quarter and per trailing twelve months
Integrated web browser automatically links to research for a company being analyzed
Automatically download price history charts, stock news, earnings estimates, competitors, and much more
Generate and print crisp, clear reports with the Report generator page
2 Page Stock Investment Guide
New single-page Stock Summary Report (SSR)?
Company Performance Report
Automatically check for the latest version of SIG 2
Integrated Help with simple search capability
Where to buy?
Last updated price and discount information 9 years agoupdate now


 Windows 2000 and above
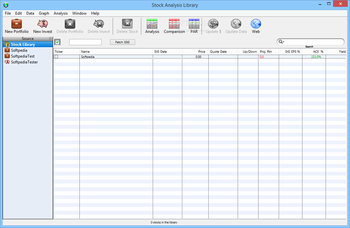
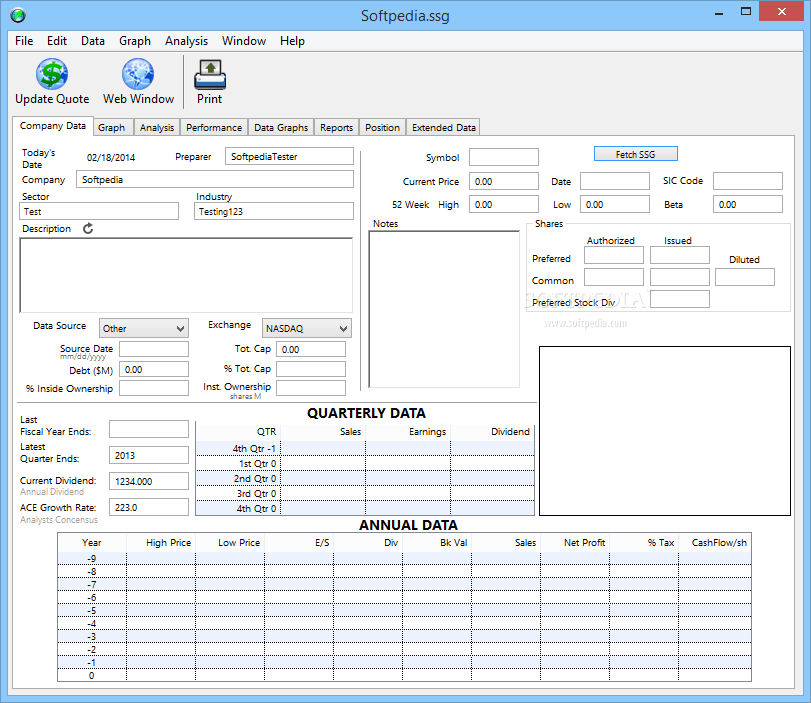
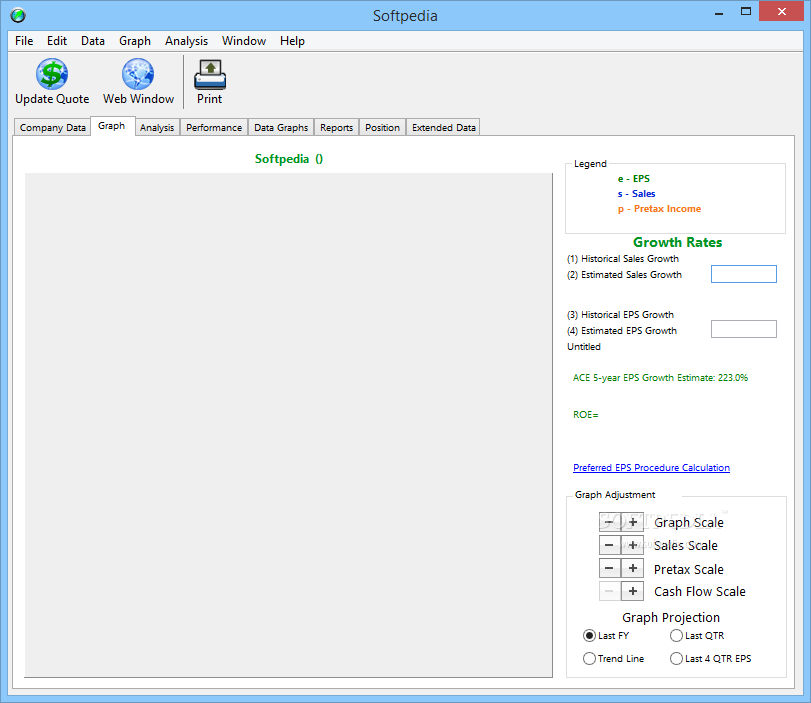
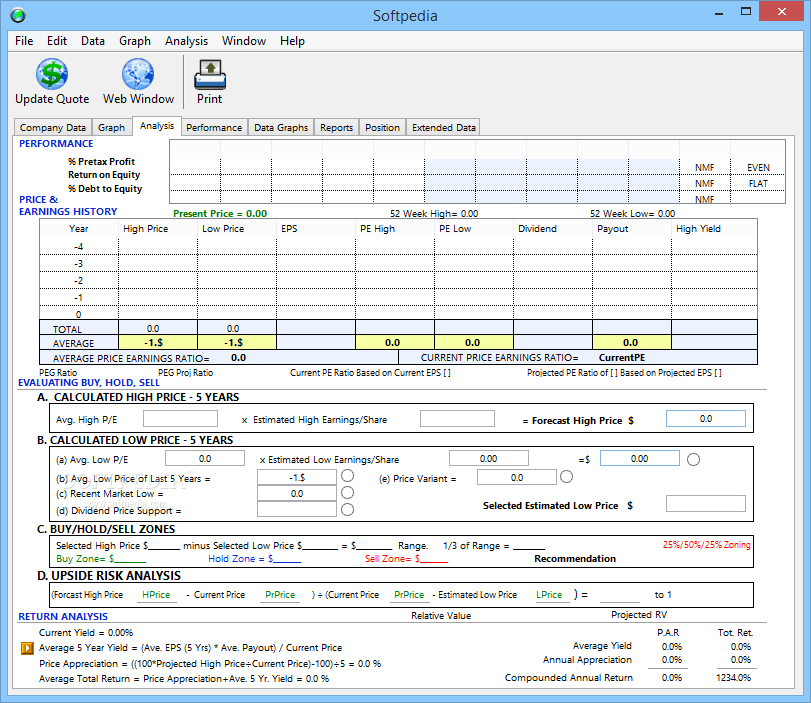
 View Screenshots(12)
 Comments
 Download


 Similar Software
 Recently Searched
 Software Categories
 Trending Software
 Like Us


